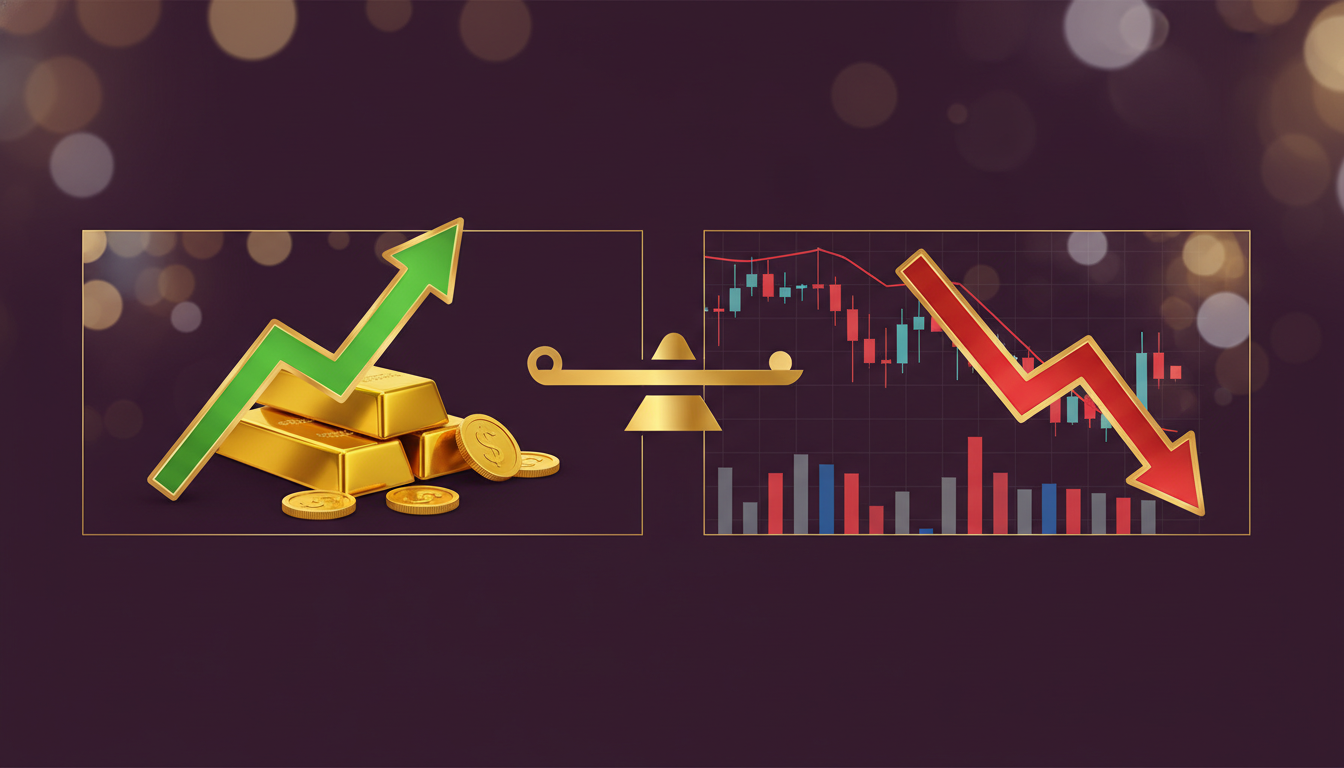
When Stocks Fall, Gold Shines: Understanding the Inverse Relationship
This week tells the story perfectly: while the S&P 500 dropped 1.2%, gold climbed 1.5%. Year-to-date, the divergence is even more dramatic—gold has surged 62.6% while the S&P 500 gained just 17.4%, according to data from Yahoo Finance.
This isn’t a coincidence. It’s the inverse correlation at work—a phenomenon that has protected investors during every major market crash for the past half-century.
Live Market Snapshot: December 2025
| Asset | Current Price | Weekly Change | YTD Return | Source |
|---|---|---|---|---|
| Gold Spot | $4,356/oz | +1.5% | +62.6% | Yahoo Finance |
| Silver Spot | $66.30/oz | +5.7% | +126.3% | Yahoo Finance |
| S&P 500 (SPY) | $680.59 | -1.2% | +17.4% | Yahoo Finance |
| Gold/Silver Ratio | 65.7 | — | — | Calculated |
| Gold in India (24K) | ₹134,010/10g | -0.5% | +58.2% | GoodReturns |
This week’s market action demonstrates the principle in real-time: when equity markets face selling pressure, gold attracts flight-to-safety capital.
What Is the Gold-Stock Correlation?
Correlation measures how two assets move relative to each other, ranging from +1 (perfect positive correlation) to -1 (perfect inverse correlation). A correlation of 0 means the assets move independently.
According to the World Gold Council, gold’s long-term correlation to the S&P 500 is approximately 0.01—essentially zero. This means gold’s price movements show virtually no relationship with stock market performance over time.
But here’s what makes gold special: during periods of market stress, this correlation often turns negative.
| Market Condition | Gold-S&P 500 Correlation | Implication |
|---|---|---|
| Normal Markets | +0.1 to +0.3 | Modest positive correlation |
| Market Stress | 0 to -0.3 | Decoupling begins |
| Market Crash | -0.3 to -0.6 | Strong inverse correlation |
| Recovery Phase | +0.1 to +0.4 | Positive correlation returns |
“Gold provides diversification in a portfolio and is often correlated with the stock market during risk-on periods, while it decouples and becomes inversely correlated during periods of stress,” explains the World Gold Council’s research team. “This is unique amongst most hedges in the marketplace.”
Historical Proof: Gold During Major Market Crashes
The theory is compelling, but does it hold up in practice? Let’s examine the data from the past 30 years of market crises.
The 2008 Financial Crisis
The 2008 crisis provides perhaps the clearest example of gold’s hedging power:
| Asset | Performance (2008) | Recovery Time | Source |
|---|---|---|---|
| S&P 500 | -38% | 4+ years | S&P Global |
| Gold | +25% | N/A (gains) | World Gold Council |
| Global Stocks | -49% | 5+ years | MSCI |
| US Treasuries | +17% | N/A (gains) | US Treasury |
According to Auronum’s historical analysis, “The financial crisis of 2008 was marked by a sharp decline in global stocks, which plummeted by -49%. U.S. Treasuries gained 17%, while gold saw an impressive rise of 47%, cementing its position as a reliable hedge against systemic risk.”
The aftermath was even more impressive. As noted by Gainesville Coins, “From its October 2008 low, gold surged 78% within two years, reaching $1,300 by October 2010 and ultimately peaking at $1,917.90 in August 2011—a 163% gain from the crisis trough.”
The 2020 COVID-19 Crash
The pandemic-induced crash of March 2020 tested gold’s safe-haven credentials once again:
| Phase | S&P 500 | Gold | Narrative |
|---|---|---|---|
| Feb 19 - Mar 23, 2020 | -34% | -12% | Initial liquidity crunch |
| Mar 23 - Aug 6, 2020 | +51% | +36% | Recovery + safe-haven demand |
| Full Year 2020 | +16.3% | +25.1% | Gold outperforms |
Gold’s initial dip during March 2020 illustrates an important nuance: during extreme liquidity crunches, even safe-haven assets can face temporary selling pressure as investors raise cash. However, gold recovered faster and reached a new all-time high of $2,072.50 by August 2020, according to the Economics Observatory.
“Gold doubled in value between 2007 and 2011,” notes BullionByPost’s recession analysis. “When the stock market collapsed in 2007, investment demand for gold spiked and continued to rise.”
The 2025 Tariff Wars
More recently, gold’s hedging ability was tested during the 2025 tariff-related market volatility:
According to VanEck’s crisis analysis, “Gold’s low correlation to equities and bonds reinforces its role as a powerful portfolio diversifier. Historically, gold has generated positive returns during every major risk event of the past 25 years—from the Global Financial Crisis to the 2025 tariff wars.”
Why Does This Inverse Correlation Exist?
Understanding the mechanism helps investors trust the relationship. Several factors drive gold’s counter-cyclical behavior:
1. Flight to Safety Psychology
When investors lose confidence in equities, they seek assets perceived as safe. According to OwnX’s market analysis, “As investors lose confidence in equities, they shift to precious metals, particularly gold, to preserve their wealth. This flight to safety pushes demand for gold, leading to an increase in gold prices.”
2. Central Bank Response to Crashes
Stock market crashes typically prompt central banks to cut interest rates and inject liquidity—both bullish for gold:
| Policy Response | Impact on Gold | Mechanism |
|---|---|---|
| Rate Cuts | Bullish | Lower opportunity cost of holding gold |
| Quantitative Easing | Bullish | Currency devaluation fears |
| Fiscal Stimulus | Bullish | Inflation expectations rise |
| Flight to Quality | Bullish | Safe-haven demand increases |
The Federal Reserve’s December 2025 rate cut to 3.5-3.75%, as reported by CNBC, exemplifies this pattern. Lower rates reduce the opportunity cost of holding non-yielding gold, making it more attractive relative to bonds.
3. Currency Devaluation Hedge
Stock market crashes often coincide with currency weakness. Gold, priced globally, maintains value across currencies. According to Bloomberg’s sponsored research, gold serves as a hedge against both market volatility and currency devaluation simultaneously.
4. Limited Supply Response
Unlike stocks, which can be created through IPOs, gold supply is constrained by mining capacity. This supply inelasticity amplifies price movements when demand surges during crises.
2025: A Case Study in Divergence
This year provides a textbook example of the gold-stocks relationship:
| Metric | Gold | S&P 500 | Spread |
|---|---|---|---|
| YTD Return | +62.6% | +17.4% | +45.2% |
| This Week | +1.5% | -1.2% | +2.7% |
| New All-Time Highs | 50+ | 12 | — |
| Volatility (30-day) | Moderate | High | — |
According to the World Gold Council’s Q3 2025 report, “Gold demonstrated positive returns in 10 out of 11 months in 2025, achieving a 60.7% gain over that period—its strongest annual performance in nearly 46 years.”
Meanwhile, VanEck notes, “As of late 2025, gold continues to outperform major equity benchmarks, including the S&P 500, over multiple time horizons. In the past 12 months alone, gold has more than doubled the returns of the S&P 500 Index.”
Optimal Portfolio Allocation for Hedging
Given gold’s proven hedging ability, how much should you allocate? Expert recommendations cluster around 5-10%:
| Source | Recommended Allocation | Rationale |
|---|---|---|
| World Gold Council | 5-8% | Optimal risk-adjusted returns |
| UBS Wealth Management | Mid-single digits | Diversification during stress |
| Ray Dalio (Bridgewater) | 15% | All-weather portfolio approach |
| SPDR Research | 2.5-10% | 12% Sharpe ratio improvement |
“The World Gold Council simulation indicates that the optimal allocation to gold rests between 5% and 8%,” according to their research findings. “This would have helped improve risk-adjusted returns and reduce volatility.”
Portfolio Scenarios
| Portfolio Type | Stocks | Bonds | Gold | Expected Crash Protection |
|---|---|---|---|---|
| Traditional 60/40 | 60% | 40% | 0% | Moderate |
| Conservative Hedge | 55% | 35% | 10% | Enhanced |
| All-Weather Style | 50% | 35% | 15% | Strong |
| Maximum Diversification | 45% | 35% | 20% | Very Strong |
Important Caveats: When Gold Doesn’t Work
No hedge is perfect. Understanding gold’s limitations is crucial:
Liquidity Crunches
During the initial phase of severe market crashes, gold can fall alongside stocks as investors sell everything for cash. According to Gainesville Coins, “While precious metals generally benefit from stock market crashes, initial liquidity pressures can cause temporary price declines before the flight-to-safety demand takes over.”
This happened in:
- October 2008: Gold dropped 28% before recovering 78%
- March 2020: Gold fell 12% before hitting new all-time highs
Rising Real Interest Rates
When real (inflation-adjusted) interest rates rise sharply, gold typically underperforms. However, this scenario is rare during stock market crashes, which usually prompt rate cuts.
Recent Correlation Shifts
Morningstar’s 2025 analysis notes a concerning trend: “In 2025, the Morningstar category of funds investing in precious metals, including gold, showed positive correlations in euros compared to most other categories, reversing the trend in both 2023 and 2024.”
This suggests gold’s diversification benefits may be evolving. However, the analysis also notes this primarily affects day-to-day correlations—during major stress events, gold continues to decouple from equities.
Practical Implementation Strategies
Strategy 1: Static Allocation
Maintain a fixed 5-10% gold allocation, rebalancing quarterly:
| When Gold… | Action | Rationale |
|---|---|---|
| Outperforms (under 5% portfolio) | Buy more gold | Rebalance to target |
| Underperforms (over 10% portfolio) | Sell some gold | Lock in gains |
| Near target (5-10%) | Hold | Maintain allocation |
Strategy 2: Dynamic Allocation
Increase gold allocation during periods of elevated market risk:
| VIX Level | Suggested Gold Allocation | Risk Environment |
|---|---|---|
| Under 15 | 5% | Low fear |
| 15-25 | 7.5% | Normal |
| 25-35 | 10% | Elevated stress |
| Over 35 | 12-15% | High fear |
Strategy 3: Dollar-Cost Averaging
Systematically build your gold position over time to reduce timing risk:
| Approach | Benefit | Best For |
|---|---|---|
| Monthly purchases | Smooths volatility | Long-term investors |
| Quarterly rebalancing | Maintains target allocation | Moderate-sized portfolios |
| Crash buying | Maximum hedge value | Tactical investors |
India and NRI Context
For Indians, gold’s hedging value carries additional significance:
Cultural Wealth Preservation
According to the World Gold Council, Indian households hold over 25,000 tonnes of gold—roughly 11% of the world’s above-ground gold supply. This isn’t just investment; it’s generational wealth preservation.
Gold Prices in India Today
| Gold Type | Price (₹/10g) | Weekly Change | Source |
|---|---|---|---|
| 24 Karat | ₹134,010 | -0.5% | GoodReturns |
| 22 Karat | ₹122,753 | -0.5% | GoodReturns |
| 18 Karat | ₹100,508 | -0.5% | GoodReturns |
NRI Portfolio Considerations
For NRIs with exposure to both US and Indian markets, gold provides unique advantages:
| Benefit | Explanation |
|---|---|
| Dual-market hedge | Protects against both US and Indian equity downturns |
| Currency neutral | Value maintained regardless of USD/INR movements |
| Cross-border flexibility | Digital gold works seamlessly across markets |
| Cultural liquidity | Easily gifted or transferred to family in India |
The Bottom Line: Building a Crash-Resistant Portfolio
The data is clear: gold has served as an effective hedge during every major market crisis of the modern era. While not perfect, its near-zero long-term correlation to stocks—and tendency to turn negative during crashes—makes it uniquely valuable for portfolio protection.
Key Takeaways
| Point | Evidence |
|---|---|
| Gold-stock correlation is near zero | 0.01 over 20 years (World Gold Council) |
| Correlation turns negative during crashes | 2008: Gold +25% while S&P -38% |
| 5-10% allocation is optimal | Improves Sharpe ratio by 12% (SPDR) |
| Expect initial dips during liquidity crunches | March 2020: -12% then +36% |
| 2025 proves the thesis | Gold +62.6% vs S&P +17.4% |
As we navigate an uncertain economic environment with elevated valuations and geopolitical tensions, having gold as portfolio insurance isn’t just prudent—it’s mathematically justified.
Start Building Your Gold Hedge with Mantra Mint
Ready to add crash protection to your portfolio? Mantra Mint makes it simple for Indians in the USA to build a gold position systematically.
Why Mantra Mint for Portfolio Hedging?
- Start with just $10: Begin building your gold hedge immediately, no minimum
- Auto-invest feature: Set up recurring purchases to dollar-cost average automatically
- Instant liquidity: Convert to cash quickly when you need to rebalance
- 24K pure gold: Fully backed, securely vaulted, professionally managed
- Track correlations: Monitor your gold position alongside your stock portfolio
Whether you’re building your first gold position or adding to an existing hedge, Mantra Mint helps you protect wealth the way generations of Indian families have—through gold.
👉 Start Your Gold Hedge Today — Because the best time to build crash protection is before you need it.
Sources
- World Gold Council - Gold Correlation Data
- World Gold Council - Gold Mid-Year Outlook 2025
- Yahoo Finance - Gold Futures
- Yahoo Finance - S&P 500 ETF (SPY)
- VanEck - Gold in a Storm: How Gold Holds Up During Market Crises
- Auronum - Shining Through Chaos: Gold’s Behavior in Crises
- Gainesville Coins - Gold Price in 2008
- SPDR Gold Shares - Investment Research
- Economics Observatory - Is Gold a Safe Haven?
- BullionByPost - Gold and Recession
- CNBC - Fed Interest Rate Decision December 2025
- GoodReturns - Gold Rates India
- OwnX - What Happens to Gold When Stock Market Crashes
- Morningstar - Gold Behaving Like Equities?
Ready to start investing in gold?
Join thousands of Indian families building wealth with Mantra Mint.
Get Started Free