Is the Stock Market Overvalued? CAPE Ratio, Buffett Indicator & Why Gold Shines
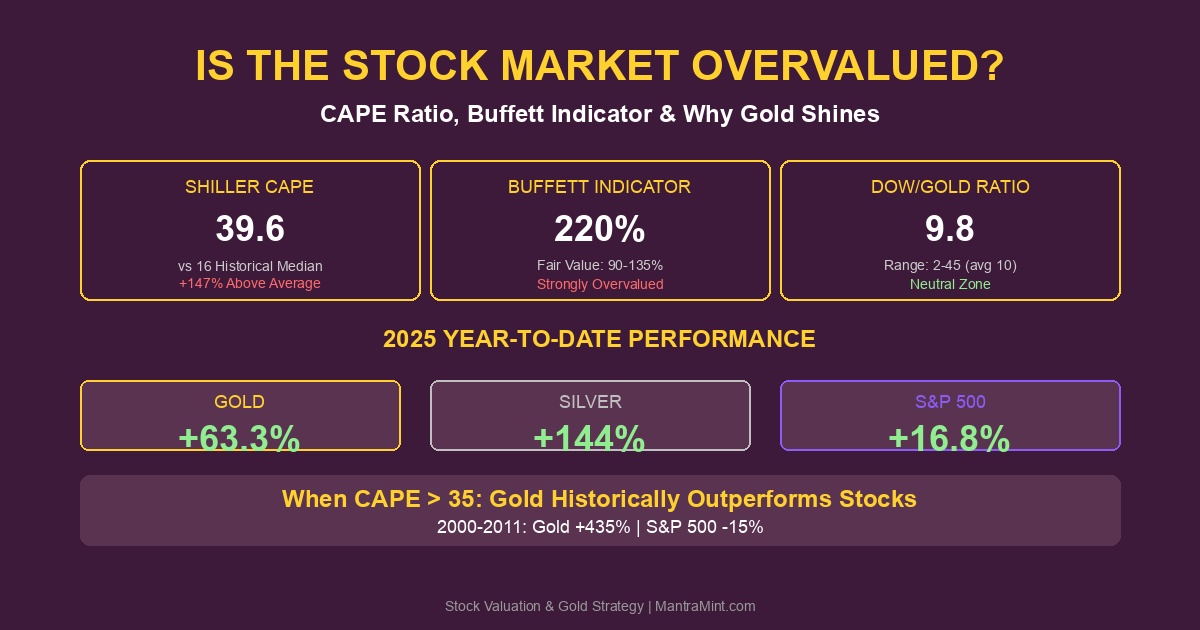
The stock market enters 2026 at valuations that have only been exceeded once in 154 years of recorded history. With the Shiller CAPE ratio at 39.6 and the Buffett Indicator at 220%, investors face a critical question: is it time to diversify into gold?
According to GuruFocus, the current CAPE is 147% above the historical median of 16.04, implying forward annual returns of just 1.7% for stocks over the next decade. Meanwhile, gold has surged +63.3% in 2025, its best year since 2010.
Let’s examine what these valuation metrics mean—and why gold has historically outperformed during periods of stock market excess.
Current Market Valuations (January 2026)
Key Valuation Metrics
| Metric | Current Value | Historical Average | Assessment | Source |
|---|---|---|---|---|
| Shiller CAPE | 39.6 | 16.04 (median) | +147% above | Multpl |
| Buffett Indicator | 220% | 90-135% fair value | Strongly Overvalued | Current Market Valuation |
| Regular P/E | 29.1 | 25.2 (20-year avg) | +15% above | GuruFocus |
| Dow/Gold Ratio | ~9.8 | 10 (long-term avg) | Neutral | LongtermTrends |
| S&P 500 Earnings Yield | 2.5% | 6.7% (historical) | -63% below | Calculated |
Data as of January 2, 2026
Asset Performance Comparison (2025 YTD)
| Asset | 2025 Return | Source |
|---|---|---|
| Gold | +63.3% | Yahoo Finance |
| Silver | +144.0% | Yahoo Finance |
| S&P 500 | +16.8% | Yahoo Finance |
| Implied Stock Return (Next 8 Years) | -0.4%/year | GuruFocus |
Understanding the Shiller CAPE Ratio
What is CAPE?
The Cyclically Adjusted Price-to-Earnings ratio, created by Nobel laureate Robert Shiller, divides the current price of the S&P 500 by the average of 10 years of inflation-adjusted earnings. According to Wikipedia, it is “principally used to assess likely future returns from equities over 10 to 20 year timescales.”
Why CAPE Matters for Investors
According to Research Affiliates, “Robert Shiller demonstrated using 130 years of back-tested data that the returns of the S&P 500 over the next 20 years are strongly inversely correlated with the CAPE ratio.”
Key Findings:
- CAPE values have a -0.7 correlation with future 10-year returns
- The log of CAPE shows correlation with subsequent returns stronger than -80%
- High CAPE = Low future returns (and vice versa)
Historical CAPE Extremes
| Period | CAPE Value | What Happened Next |
|---|---|---|
| 1929 Peak | 32.6 | Great Depression; stocks didn’t recover for 25 years |
| 1999 Peak | 44.2 | Dot-com crash; S&P 500 flat for 13 years |
| 2007 Peak | 27.5 | Financial crisis; -57% crash |
| January 2026 | 39.6 | Second highest in history |
Source: Multpl Shiller PE
The Buffett Indicator: Market Cap to GDP
What Warren Buffett Said
In a 2001 Fortune Magazine interview, Warren Buffett called the Market Cap to GDP ratio “probably the best single measure of where valuations stand at any given moment.” According to GuruFocus, Buffett said:
“A range of 75-90% is reasonable; over 120% suggests the stock market is overvalued.”
Current Reading: 220%
According to Current Market Valuation, as of January 2, 2026, the TMC/GNP ratio is 219.9%—approximately 76.62% (or about 2.4 standard deviations) above the historical trend line.
| Buffett Indicator Range | Assessment |
|---|---|
| Below 75% | Significantly Undervalued |
| 75-90% | Fair Value |
| 90-120% | Modestly Overvalued |
| 120-150% | Overvalued |
| Above 150% | Strongly Overvalued |
| Current: 220% | Extreme |
What This Predicts
According to GuruFocus projections:
- Expected stock market return over next 8 years: -0.4% annually
- Expected return including Fed balance sheet adjustment: -0.5% annually
Gold Performance During High Valuation Periods
Why Gold Shines When Stocks Are Expensive
According to Bullion Trading LLC, “During previous episodes when CAPE reached extreme levels, gold dramatically outperformed.”
Historical Evidence
2000-2011: The Lost Decade for Stocks
| Asset | Jan 2000 → Dec 2010 | Total Return |
|---|---|---|
| S&P 500 | 1,461 → 1,242 | -15% |
| Gold | $275/oz → $1,200/oz | +336% |
| Silver | $5/oz → $30/oz | +500% |
Sources: MacroTrends, Yahoo Finance
An investor with $100,000 in the S&P 500 at the 2000 market peak saw that investment decline to approximately $85,000 by 2010. The same amount in gold would have grown to $436,000.
2008 Financial Crisis
According to StoneX Futures:
| Asset | 2008 Performance | 18-Month Performance (Peak to Trough) |
|---|---|---|
| S&P 500 | -38% | -57% |
| Gold | +5.5% | +25% |
| Gold (2008-2012) | - | +95% |
“While the S&P continued to decline, gold rebounded and ended the year up 5.5 percent. Over the total 18-month stock market selloff, gold rose more than 25 percent.”
Post-Dot-Com Recovery
According to Auronum:
- Gold’s increase after the dot-com bubble: +167.29%
- This “underscores its role as a safe haven and wealth preservation tool during prolonged financial uncertainty”
The Dow-to-Gold Ratio
What It Tells Us
The Dow-to-Gold ratio measures how many ounces of gold it takes to buy one “share” of the Dow Jones Industrial Average. According to LongtermTrends:
| Ratio Level | Historical Context |
|---|---|
| 2-5 | Stocks very cheap vs gold (1932, 1980) |
| 10 | Long-term average |
| 20+ | Stocks expensive vs gold (1929, 1999) |
| 45 | All-time high (1999) |
| ~9.8 | Current (January 2026) |
What the Current Ratio Means
According to Seeking Alpha, “The recent breakdown in the Dow-to-gold ratio may signal that it’s time to consider getting out of stocks and into gold.”
The current ratio near 10 is historically neutral, but:
- In 2020, it was closer to 18
- In 2000, it peaked at 45
- The trend is declining (favoring gold)
Current Precious Metals Snapshot
| Metal | Price | Weekly Change | 2025 YTD | Source |
|---|---|---|---|---|
| Gold Spot | $4,342/oz | +0.4% | +63.3% | Yahoo Finance |
| Silver Spot | $72.26/oz | +3.4% | +144.0% | Yahoo Finance |
| Gold/Silver Ratio | 60.1 | - | - | Calculated |
| Gold (INR 22K) | ₹10,881/g | - | +58% | GoodReturns |
Data via yfinance as of January 2, 2026
Why This Time Might Be Different (Or Not)
Arguments for Caution
According to The Motley Fool:
- Tech Company Quality: “Today’s mega-cap tech companies differ meaningfully from companies that populated earlier versions of the index”
- Foreign Revenues: The Buffett Indicator uses domestic GDP but companies earn globally
- Low Interest Rates: Lower rates justify higher multiples
- AI Productivity: Potential for earnings growth to accelerate
Arguments for Gold Allocation
According to AInvest:
- Historical Precedent: High CAPE has always mean-reverted eventually
- Math Problem: 2.5% earnings yield vs 4%+ risk-free rates
- Central Bank Buying: Record gold purchases by central banks continue
- Geopolitical Risk: Elevated uncertainty supports safe-haven demand
Portfolio Implications for 2026
The Rational Allocation Framework
| Investor Profile | Stock Allocation | Gold Allocation | Rationale |
|---|---|---|---|
| Aggressive (Young) | 70% | 10-15% | Time to recover from correction |
| Moderate | 55% | 15-20% | Balanced risk/reward |
| Conservative | 40% | 20-25% | Capital preservation priority |
| Retired | 30% | 25-30% | Income + inflation hedge |
What Smart Money Is Doing
According to the World Gold Council:
- Central Banks: Record buying continues (>1,000 tonnes/year)
- ETF Flows: Gold ETFs seeing renewed inflows after 2025 rally
- Institutional Allocation: Average pension fund gold allocation rising
The Gold Correlation Advantage
According to the World Gold Council, “Gold provides diversification in a portfolio and is often correlated with the stock market during risk-on periods, while it decouples and becomes inversely correlated during periods of stress.”
This asymmetric behavior—rising with stocks during good times, rising when stocks crash—makes gold uniquely valuable at current valuations.
How to Position Your Portfolio
For New Investors
| Strategy | Action | Rationale |
|---|---|---|
| Start Small | 5% gold allocation | Test your comfort level |
| Dollar-Cost Average | Monthly purchases | Reduces timing risk |
| Diversify Within Gold | Physical + ETFs + miners | Different risk profiles |
For Existing Stock Holders
| Strategy | Action | Rationale |
|---|---|---|
| Rebalance | Trim winners, add gold | Lock in 2025 gains |
| Hedge | Add gold on stock rallies | Insurance at “cheaper” prices |
| Dollar-Cost Out | Systematic profit-taking | Reduces emotional decisions |
For NRIs and Indian-Americans
With both US stocks and Indian markets at elevated valuations:
- Dual Currency Hedge: Gold hedges both USD and INR risks
- Cultural Alignment: Gold for festivals, weddings, and traditions
- Intergenerational Wealth: Physical gold passes easily to heirs
- Digital Options: Platforms like Mantra Mint enable fractional gold ownership
Key Takeaways
- CAPE at 39.6 is the second-highest reading in 154 years (only 1999 was higher)
- Buffett Indicator at 220% suggests stocks are “strongly overvalued”
- Historical Pattern: Gold dramatically outperformed during both previous CAPE extremes
- 2000-2011 Example: Gold +336% while S&P 500 -15%
- Implied Future Returns: Stocks expected to return -0.4%/year over next 8 years
- Gold’s 2025: +63.3% YTD, best year since 2010
Conclusion: The Case for Gold in 2026
The combination of a 39.6 CAPE ratio, 220% Buffett Indicator, and the second-highest valuations in market history creates a compelling case for gold allocation. While high valuations don’t guarantee an imminent crash, they do predict poor long-term stock returns with high statistical confidence.
Gold’s 2025 performance (+63.3%) demonstrates that the market is already pricing in these concerns. But if history is any guide, gold’s outperformance during valuation extremes can persist for a decade or more.
For investors—especially NRIs balancing US and Indian financial goals—a gold allocation provides:
- Portfolio insurance against stock market corrections
- Currency diversification against both USD and INR volatility
- Cultural relevance for gifting and family wealth transfer
- Inflation protection in an uncertain monetary environment
The math is simple: When stocks offer a 2.5% earnings yield and gold offers millennial-tested wealth preservation, the case for diversification has rarely been stronger.
Build your gold position today with Mantra Mint—fractional gold ownership that fits any portfolio.
Sources
- GuruFocus - S&P 500 Shiller CAPE Ratio
- Multpl - Shiller PE Ratio
- Current Market Valuation - Buffett Indicator
- GuruFocus - Stock Market Valuations
- LongtermTrends - Dow to Gold Ratio
- Wikipedia - Cyclically Adjusted Price-to-Earnings Ratio
- Research Affiliates - CAPE Fear
- Bullion Trading LLC - CAPE Ratio Analysis
- MacroTrends - Gold Price vs Stock Market 100 Year Chart
- StoneX Futures - Gold and the 2008 Financial Crisis
- Auronum - Gold’s Behavior in Crises
- Yahoo Finance - Gold Futures (GC=F)
- Yahoo Finance - Silver Futures (SI=F)
- World Gold Council - Gold Correlation
- The Motley Fool - S&P 500 2026 Outlook
- Seeking Alpha - Dow to Gold Ratio Analysis
- AInvest - Stock Market Correction 2026 Analysis
Ready to start investing in gold?
Join thousands of Indian families building wealth with Mantra Mint.
Get Started Free