Peak Gold: Why Mining Supply Constraints Support Higher Prices in 2026
While gold prices have surged past $5,000 per ounce in 2026, something strange is happening underground: production has barely budged. According to the World Gold Council, mined gold output reached 3,645 tonnes in 2024—just 4 tonnes higher than the previous year and only 13 tonnes shy of the 2018 record.
This disconnect between skyrocketing prices and stagnant production tells a crucial story about gold’s future. For investors, understanding “peak gold” could be the most important factor in your long-term investment thesis.
Current Market Snapshot (February 4, 2026)
| Metric | Current Value | Weekly Change | Source |
|---|---|---|---|
| Gold Spot Price | $5,006/oz | +6.2% | Yahoo Finance |
| Silver Spot Price | $89.47/oz | +14.3% | Yahoo Finance |
| Gold/Silver Ratio | 56.0 | Compressing | Calculated |
| Industry AISC | $1,424/oz | Q2 2025 average | World Gold Council |
What Is “Peak Gold”?
“Peak gold” refers to the point at which global gold mining production reaches its maximum and begins to decline, regardless of price. Unlike oil, where peak production debates have raged for decades, gold’s plateau is already visible in the data.
According to CRU Group analyst Oliver Blagden, “Reserves will deplete, ore grades will decline and aging mines will close.” He predicts global gold production will peak and then fall below 3,250 tonnes by 2026.
Gold Production History
| Period | Annual Production | Trend |
|---|---|---|
| 2010 | ~2,740 tonnes | Rising |
| 2015 | ~3,200 tonnes | Rising |
| 2018 | 3,658 tonnes | All-time high |
| 2020 | ~3,400 tonnes | COVID dip |
| 2024 | 3,645 tonnes | Plateau |
| 2025 (projected) | ~3,700 tonnes | Near plateau |
Despite gold prices more than doubling since 2018 (from ~$1,300 to $5,000+), production has barely moved. This is unprecedented in commodity markets.
The Numbers Behind Peak Gold
Total Gold Ever Mined
According to the World Gold Council, approximately 219,890 tonnes of gold have been mined throughout human history. If you gathered all of it, it would form a cube measuring just 22 meters on each side.
| Category | Amount | Share |
|---|---|---|
| Jewelry | 97,149 tonnes | 45% |
| Investment (bars/coins/ETFs) | 48,634 tonnes | 22% |
| Central Bank Reserves | 37,755 tonnes | 17% |
| Industrial/Other | 32,727 tonnes | 15% |
| Total Above Ground | ~216,000 tonnes | 100% |
What’s Left Underground
According to USGS Mineral Commodity Summaries 2025, proven gold reserves total approximately 64,000 tonnes globally:
| Country | Reserves (tonnes) | Share |
|---|---|---|
| Russia | 12,000 | 19% |
| Australia | 12,000 | 19% |
| South Africa | 5,000 | 8% |
| United States | 3,000 | 5% |
| Indonesia | 3,800 | 6% |
| China | 3,000 | 5% |
| Others | 25,200 | 39% |
| World Total | 64,000 | 100% |
At current production rates (~3,650 tonnes/year), proven reserves would last approximately 17 years. However, this understates the challenge—reserve replacement has failed to keep pace with production.
Why Production Has Stalled
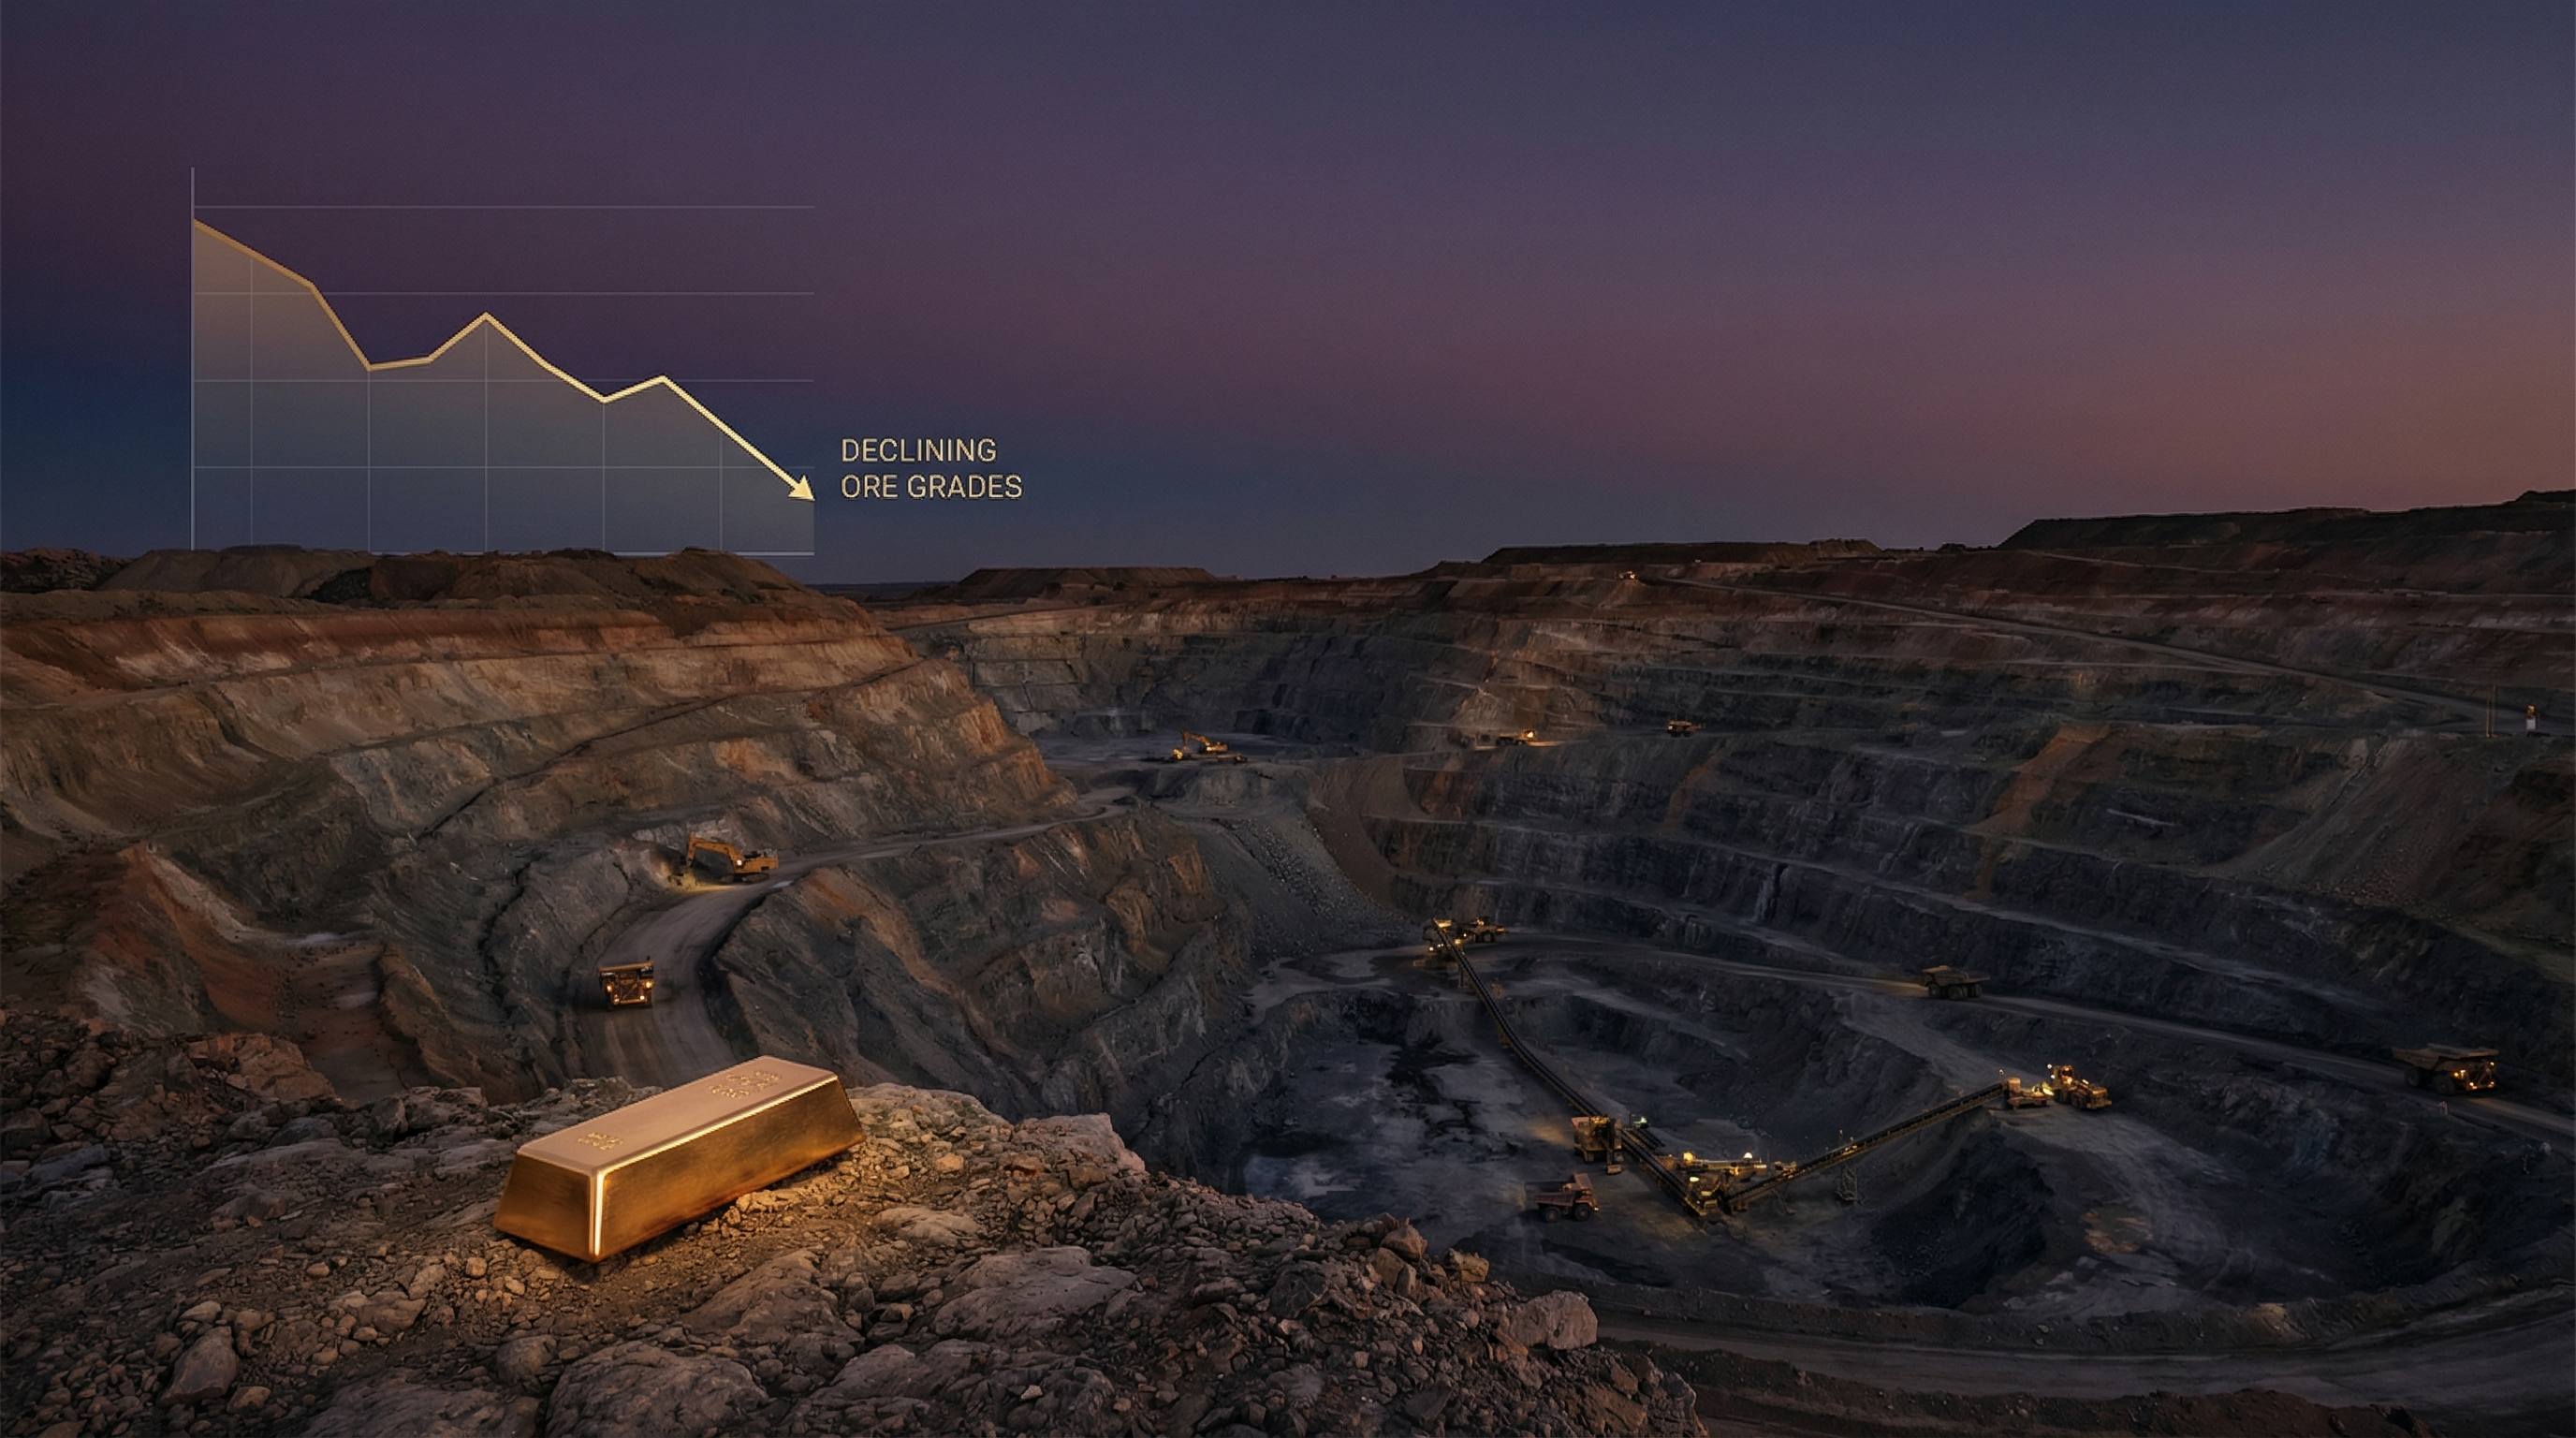
1. Declining Ore Grades
The gold industry’s biggest challenge is that the easy gold has already been found. According to S&P Global, average gold grades have declined 13.4% since 2012:
| Year | Average Ore Grade | Change |
|---|---|---|
| 2012 | 1.51 g/t Au | Baseline |
| 2017 | 1.38 g/t Au | -8.6% |
| 2022 | 1.31 g/t Au | -13.4% |
| 2024 | ~1.25 g/t Au | ~-17% |
What this means: Miners must now process 25% more rock to produce the same amount of gold compared to 2012. A mine profitable at 3 grams per tonne may become marginal at 1 gram per tonne.
2. Disappearing Discoveries
According to S&P Global research, new gold discoveries have collapsed:
| Decade | Major Deposits Found | Avg Size |
|---|---|---|
| 1990s | 132 | 9.0 Moz |
| 2000s | 93 | 7.7 Moz |
| 2010s | 25 | 5.0 Moz |
| 2020-2024 | 6 | 4.4 Moz |
“The largest and most prolific reserves have already been found,” notes CFRA Research analyst Matthew Miller. “Gold miners are struggling to grow reserves in line with their production.”
Even more concerning: only 19% of 2024 exploration spending went to grassroots (new frontier) projects, versus approximately 50% in the mid-1990s. Miners are increasingly focusing on extending existing mines rather than finding new deposits.
3. Rising Production Costs
According to World Gold Council AISC data, all-in sustaining costs continue climbing:
| Region | Q2 2025 AISC | YoY Change |
|---|---|---|
| Global Average | $1,424/oz | +9.2% |
| United States | $1,716/oz | +7.9% |
| Canada | $1,513/oz | +3.1% |
| Oceania | $1,464/oz | +15.0% |
Cost drivers include:
- U.S. mining wages rose 8.1% year-over-year
- Skilled labor shortages in Australia commanding 12% premiums
- Deeper, more complex mining operations
- Stricter environmental regulations
4. Record Material Movement for Flat Output
According to S&P Global, global tonnages of ore and waste moved reached record highs:
| Year | Ore + Waste (billion tonnes) | Strip Ratio |
|---|---|---|
| 2022 | ~27 billion tonnes | 4.24:1 |
| 2023 | 28.7 billion tonnes (record) | 2.51:1* |
| 2024 | Higher still | Rising |
*Strip ratio methodology varies; open-pit average vs. industry-wide average
Miners are moving more earth than ever to extract stagnant gold volumes—a textbook symptom of resource depletion.
The Case Study: South Africa’s Collapse
South Africa provides a sobering preview of what peak gold looks like in practice.
According to historical data, South Africa was once the world’s dominant gold producer:
| Year | South Africa Production | Global Rank |
|---|---|---|
| 1970 | ~1,000 tonnes | #1 (70% of world) |
| 2000 | ~430 tonnes | #1 |
| 2010 | ~190 tonnes | #5 |
| 2020 | ~90 tonnes | Outside Top 10 |
| 2024 | ~75 tonnes | #11 |
Ghana has now surpassed South Africa as Africa’s leading gold producer with 125 tonnes in 2024. The lesson: even the richest gold endowments eventually deplete.
Supply’s Other Component: Recycling
Gold differs from other commodities in one crucial way: it’s virtually indestructible. All gold ever mined still exists somewhere.
According to World Gold Council supply data, recycling has become increasingly important:
| Year | Recycled Gold | Share of Supply |
|---|---|---|
| 2022 | ~1,140 tonnes | 24% |
| 2023 | ~1,234 tonnes | 25% |
| 2024 | 1,368 tonnes | 28% |
| 2025 H1 | ~700 tonnes | 28.7% |
Recycling has risen 11% year-over-year in 2024, driven by record prices incentivizing scrap sales. However, recycling can only partially offset mining constraints—and it’s heavily dependent on price.
Where Recycled Gold Comes From
| Source | Share of Recycling |
|---|---|
| Jewelry | ~90% |
| Electronics | ~8% |
| Dental/Medical | ~2% |
What This Means for Gold Prices
The Supply-Price Disconnect
Traditional commodity economics says higher prices = higher production. But gold has broken this rule:
| Year | Gold Price | Production | Logic Failure |
|---|---|---|---|
| 2018 | $1,268/oz | 3,658 tonnes (peak) | — |
| 2020 | $1,770/oz | ~3,400 tonnes | Production DOWN despite 40% price increase |
| 2024 | $2,400/oz | 3,645 tonnes | Production flat despite 89% price increase |
| 2026 | $5,000/oz | ~3,700 tonnes (est) | Production barely up despite 294% price increase |
This suggests structural supply constraints, not temporary production bottlenecks.
Long-Term Price Implications
If supply is constrained while demand continues growing from:
- Central bank buying (863 tonnes in 2025)
- ETF investment inflows (record $89B in 2025)
- Indian and Chinese jewelry/investment demand
- De-dollarization reserves diversification
…then the only way to balance supply and demand is through higher prices.
According to JP Morgan analysis, their $6,300/oz 2026 target factors in supply constraints alongside continued central bank buying.
Comparison: Gold vs. Other Commodities
| Commodity | Can Production Easily Scale? | Supply Response to Price |
|---|---|---|
| Oil | Yes (somewhat) | Shale expands at higher prices |
| Copper | Moderate | New mines take 10+ years |
| Silver | Limited | Byproduct of other mining |
| Gold | Very Limited | Plateaued despite 300% price gain |
Gold’s unique supply dynamics make it fundamentally different from other commodities—and potentially more bullish long-term.
What Investors Should Understand
1. Supply Constraints Are Structural, Not Cyclical
Unlike temporary supply disruptions (COVID, strikes, weather), peak gold reflects geological reality. You can’t create more gold deposits.
2. High Prices Don’t Guarantee New Supply
The mining industry has tried. According to S&P Global, exploration spending in 2023 dropped 15%, followed by another 7% in 2024—even as prices hit records. Miners aren’t finding new deposits worth developing.
3. Recycling Has Limits
Recycled supply can’t replace new production indefinitely. As jewelry moves from Western markets to India/China (where it’s rarely resold), recycling rates may plateau.
4. Above-Ground Stock Matters
The ~216,000 tonnes of above-ground gold provides a buffer, but most is held as jewelry (often illiquid), central bank reserves (strategic holdings), or investment products (already in strong hands).
Practical Takeaways for Gold Investors
Why Supply Constraints Support Your Position
| Factor | Implication |
|---|---|
| Flat production | Limited new supply even at $5,000+ |
| Declining ore grades | Each ounce costs more to produce |
| Rising AISC | Floor price for production rising |
| Disappearing discoveries | Future supply growth unlikely |
| Recycling near capacity | Limited incremental supply |
Investment Approaches
| Strategy | Rationale |
|---|---|
| Long-term accumulation | Supply constraints favor patient holders |
| Systematic buying (DCA) | Averaging into a structurally constrained asset |
| Physical/allocated gold | Direct exposure to scarce resource |
| Ignore short-term volatility | Focus on decade-long supply fundamentals |
Key Takeaways
-
Gold production has plateaued near 3,650 tonnes: Despite prices rising from $1,268 to $5,000+, production has barely increased since 2018
-
Ore grades have declined 13% since 2012: Miners must process 25% more rock to produce the same gold
-
Only 64,000 tonnes in proven reserves: At current rates, approximately 17 years of supply remains economically viable
-
New discoveries have collapsed: Only 6 major deposits found since 2020, compared to 132 in the 1990s
-
AISC continues rising: Average production costs hit $1,424/oz in Q2 2025, up 9.2% year-over-year
-
South Africa shows peak gold in action: Production down 90%+ from 1970 peak despite higher prices
-
Supply constraints support long-term prices: Unlike other commodities, gold can’t easily scale production
Build Your Gold Position in a Supply-Constrained World
If gold production has peaked while demand continues growing, patient accumulation makes sense. You don’t need to time the market—you need to own the asset.
Why Mantra Mint for systematic gold investing:
- Start with just $10: Build your position at any budget
- Auto-invest feature: Dollar-cost average like central banks do
- Real gold, real ownership: Your gold is fully backed
- Track your ounces: Focus on accumulation, not just dollar value
Central banks bought 863 tonnes in 2025. Miners produced just 3,645 tonnes. The math favors patient accumulators.
Current Price: Gold $5,006/oz | Silver $89.47/oz
Start Your Gold Accumulation Today — Own a scarce resource getting scarcer.
Sources
- World Gold Council - Is Mined Gold Production Peaking?
- World Gold Council - Supply Data Q1 2025
- World Gold Council - How Much Gold Has Been Mined
- World Gold Council - AISC Gold Data
- World Gold Council - Gold Supply Full Year 2024
- USGS Mineral Commodity Summaries 2025 - Gold
- S&P Global - Gold Mine Stripping Ratios and Grades
- S&P Global - AISC Trends US and Canada
- Mining.com - CRU Analyst on Gold Production Cliff
- Visual Capitalist - Unmined Gold Reserves by Country
- Coinweek - Global Gold Supply 2025
- Phoenix Refining - Are We Running Out of Gold?
- JP Morgan - Gold Price Research
- Yahoo Finance - Gold Futures
- Yahoo Finance - Silver Futures
Ready to start investing in gold?
Join thousands of Indian families building wealth with Mantra Mint.
Get Started Free