Gold vs Stocks

Gold vs S&P 500 in 2025: Why the Yellow Metal Is Crushing Stocks (+72% vs +16%)

Gold vs S&P 500 in 2025: Why the Yellow Metal Is Crushing Stocks (+72% vs +16%)

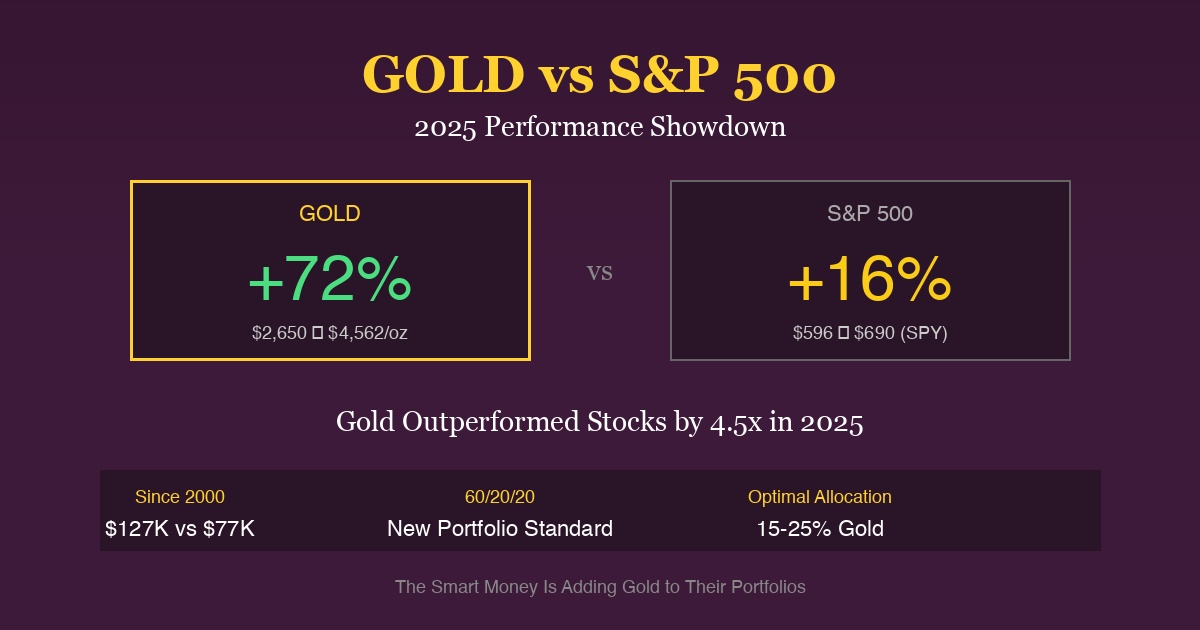
Gold has delivered a stunning +72% return in 2025, utterly crushing the S&P 500’s +16% gain. This 4.5x outperformance marks the widest margin between gold and stocks since the 1970s stagflation era. As a result, major financial institutions are abandoning the traditional 60/40 portfolio and recommending unprecedented gold allocations.

According to Visual Capitalist, $10,000 invested in gold at the start of 2000 has grown to $126,596—compared to just $77,496 for the S&P 500 with dividends reinvested. Gold’s compound annual growth rate of 10.4% has beaten stocks’ 8.3% over this period.

Current Market Snapshot

MetricCurrent2025 YTDSource
Gold Spot Price$4,562/oz+72.2%Yahoo Finance
Silver Spot Price$79.67/oz+170%Yahoo Finance
S&P 500 (SPY)$690.31+15.8%Yahoo Finance
Gold vs S&P 5004.5x outperformanceYTD comparison

Gold Prices in India Today

MetricPrice (₹)ChangeSource
24K Gold (10g)₹1,40,020+₹770GoodReturns
22K Gold (10g)₹1,28,350+₹700Market data
18K Gold (10g)₹1,05,020+₹580Market data
USD/INR89.75-6% YTDLive rate

2025 Performance: The Numbers Don’t Lie

According to Nasdaq and Berenberg:

Year-to-Date Comparison

AssetStarting Price (Jan 1)Current PriceYTD Return
Gold$2,650/oz$4,562/oz+72.2%
Silver$29.50/oz$79.67/oz+170.1%
S&P 500 (SPY)$596$690.31+15.8%
Gold outperformance+56.4 percentage points

Key Drivers of Gold’s Dominance

FactorImpact on GoldImpact on S&P 500
Dollar weakness (-11% H1)Strong positiveMixed
Central bank buyingRecord demandNo direct impact
Inflation concernsSafe-haven flowsMargin pressure
Geopolitical uncertaintyDrives gold higherCreates volatility
Interest rate expectationsBenefits goldDepends on sector

Since 2000: Gold’s Long-Term Outperformance

According to Monetary Metals and Curvo:

$10,000 Investment Since January 2000

AssetEnding Value (Oct 2025)CAGRTotal Return
Gold$126,59610.4%+1,166%
S&P 500 Total Return$77,4968.3%+675%
Difference$49,100+2.1%+491 percentage points

“Gold has significantly outpaced the S&P 500 over the last 25 years. The difference in value is $49,100, or 63.4% greater than the S&P 500 in percentage terms.” — Visual Capitalist

Why 2000 Was the Turning Point

PeriodS&P 500GoldWinner
2000-2002 (Dot-com crash)-49%+12%Gold
2007-2009 (Financial crisis)-57%+26%Gold
2020-2022 (COVID/Inflation)+33%+45%Gold
2025 YTD+16%+72%Gold

The Death of the 60/40 Portfolio

According to the World Gold Council and Advisor Perspectives:

Traditional 60/40 Is Breaking Down

MetricHistoricalCurrentProblem
Bond-equity correlationNegative+0.25No diversification
Bonds as inflation hedgeEffectiveFailedReal yields negative
Portfolio volatilityReduced by bondsNow correlatedHigher risk

“The bond-equity correlation has reached levels not seen since the mid-1990s. When both assets move in tandem, traditional diversification fails.” — World Gold Council Research

What Financial Giants Are Recommending

Expert/InstitutionGold AllocationSource
Ray Dalio (Bridgewater)10-15%Equirus Wealth
Morgan Stanley CIO20% (60/20/20)Advisor Perspectives
Jeff Gundlach (DoubleLine)25%Expert interviews
Bank of AmericaUp to 25%Alternative models
Incrementum AG14-20% optimalIn Gold We Trust Report

The New 60/20/20 Portfolio Strategy

According to Carson Group and WisdomTree:

Traditional vs Modern Allocation

AllocationTraditional 60/40New 60/20/20
Stocks60%60%
Bonds40%20%
Gold0%20%
DiversificationRelies on bondsMultiple sources

Research-Backed Gold Allocations

Gold %Risk/Reward ProfileSource
5%Minimal impactTraditional
10-15%Good hedgeRay Dalio
14-20%Optimal balanceIncrementum AG
20%Modern standardMorgan Stanley
25%Maximum protectionJeff Gundlach
40%Highest returns, higher volatilityResearch data

How Gold Protects During Market Crashes

According to MacroTrends historical data:

Gold vs S&P 500 During Major Crises

CrisisS&P 500 DrawdownGold ReturnProtection Value
1973-74 Recession-48%+73%+121 pp
1987 Black Monday-33%+5%+38 pp
2000-02 Dot-com-49%+12%+61 pp
2008 Financial Crisis-57%+5%+62 pp
2020 COVID Crash-34%+3% (then rallied)+37 pp

Why Gold Works as Crisis Insurance

MechanismHow It Protects
Flight to safetyMoney exits stocks, enters gold
Currency hedgeDollar often weakens in crises
No counterparty riskUnlike stocks, can’t default
Liquid 24/7Can sell anytime globally
Central bank backstopCBs buy during turmoil

The Correlation Shift: A New Era

According to Seeking Alpha and BlackRock:

Historical Correlation Patterns

PeriodGold-Equity CorrelationImplication
1980-2020Negative (-0.1 to -0.3)Diversification worked
2021-2024Near zeroNeutral
2025Positive (+0.25)Both rising together

“The fascinating aspect to the latest price move in gold is that it’s occurring with positive correlation to the S&P 500, as opposed to the negative correlation that gold had with equities for the last 40 years.” — Seeking Alpha Analysis

What Positive Correlation Means

ScenarioImpact
Bull market continuesBoth gold and stocks rise
Inflation persistsGold hedge works
Crash occursGold may correlate short-term, decouple later
Long-term viewGold remains value store

Portfolio Strategies for Different Investors

According to Sprott and Gold Survival Guide:

By Risk Profile

ProfileStock %Bond %Gold %Rationale
Conservative40%40%20%Maximum stability
Moderate60%20%20%Balanced growth
Aggressive70%10%20%Growth with hedge
Max Protection50%25%25%Defensive stance

By Investment Goal

GoalGold AllocationStrategy
Retirement (20+ years)15-20%Long-term accumulation
Wealth preservation20-25%Maximum protection
Growth focus10-15%Hedge with upside
Crisis hedge25%+Defensive positioning

Practical Implementation: How to Add Gold

Dollar-Cost Averaging Into Gold

FrequencyAmountAnnual Investment
Weekly$50$2,600
Biweekly$100$2,600
Monthly$200$2,400
Monthly$500$6,000

Gold Investment Options

MethodProsConsBest For
Digital gold (Mantra Mint)Low entry, liquidFeesRegular investors
Gold ETFs (GLD, IAU)Liquid, trackableExpense ratioBrokerage accounts
Physical coins/barsTangible, no counter-partyStorage, spreadsLarge holdings
Gold mining stocksLeverage to goldCompany riskAggressive

The Bull Case for Continued Gold Outperformance

Why Gold May Keep Beating Stocks

FactorCurrent StatusOutlook
Federal debt$38.4 trillionGrowing $6B/day
InflationPersistentAbove target
Central bank buyingRecord levelsContinuing
Dollar weakness-11% H1 2025Structural
Geopolitical riskElevatedNot improving

Price Targets from Major Banks

InstitutionGold Price TargetTimeframe
Goldman Sachs$5,000+2026
UBS$4,8002025-end
Bank of America$5,5002026
Average forecast~$5,00012-18 months

For Indian Investors: Double Benefit

Gold Advantage for NRIs

ScenarioDollar ImpactGold USDGold INR
US inflationWeakensRisesDouble gain
Rupee weaknessAmplifies returns
Portfolio hedgeProtectsWorks in both currencies

Current Pricing Advantage

MetalUSD PriceINR Price (10g)YTD Return
Gold 24K$4,562/oz₹1,40,020+75% INR
Silver$79.67/oz₹2,40,000+/kg+180%+ INR

The Bottom Line: Stocks Alone Aren’t Enough

The data is clear:

  • +72% gold vs +16% S&P 500 in 2025
  • $127K vs $77K from $10K invested since 2000
  • 60/40 is dead—60/20/20 is the new standard
  • Major institutions recommend 15-25% gold allocation
  • Central banks are buying record amounts

The traditional all-stocks portfolio is no longer optimal. The world’s largest investors—from Ray Dalio to Morgan Stanley to central banks globally—are increasing gold allocations. In an era of unprecedented debt, geopolitical uncertainty, and persistent inflation, gold isn’t just an alternative to stocks—it’s a necessary complement.

The question isn’t whether to add gold to your portfolio. It’s whether 5% is enough when the data suggests 15-25% is optimal.


Start Building Your Gold Position with Mantra Mint

Gold has crushed the S&P 500 in 2025, and the world’s top investors are recommending 20% gold allocations. Don’t wait for the market to decide for you.

Why Gold, Why Now?

  • +72% YTD vs S&P 500’s +16%
  • $127K from $10K since 2000 (vs $77K stocks)
  • Central banks buying record amounts
  • 60/20/20 replacing 60/40 portfolios

Why Mantra Mint?

  • Start with $10 — Build your allocation gradually
  • Auto-invest — Dollar-cost average like the pros
  • Instant liquidity — Sell anytime if needed
  • No storage hassles — We handle everything

The data speaks for itself. Gold belongs in every portfolio.

Start Buying Gold Now — Join the smart money.


Sources

  1. Visual Capitalist - Gold or Stocks? $10K After 25 Years
  2. Nasdaq - Can Gold Continue to Crush the S&P 500 in 2026?
  3. Monetary Metals - Gold vs the S&P 500
  4. World Gold Council - Gold’s Optimal Portfolio Weight
  5. Advisor Perspectives - 60/20/20 Portfolio Strategy
  6. Berenberg - Gold Shines More Than S&P 500 Since 2000
  7. WisdomTree - Next Frontier in Portfolio Design
  8. BlackRock - Stay Long Gold
  9. Seeking Alpha - Gold Breaks 40-Year Correlation
  10. Carson Group - Gold Strategic Portfolio Allocation
  11. Equirus Wealth - Gold Portfolio Hedge 2025
  12. Curvo - Gold vs S&P 500 Historical Performance
  13. MacroTrends - Gold Price vs Stock Market 100 Year Chart
  14. Yahoo Finance - Gold Futures
  15. GoodReturns - India Gold Rates

Ready to start investing in gold?

Join thousands of Indian families building wealth with Mantra Mint.

Get Started Free