Gold vs Oil: The Commodity Showdown of 2026 - Why Gold Is Crushing Black Gold
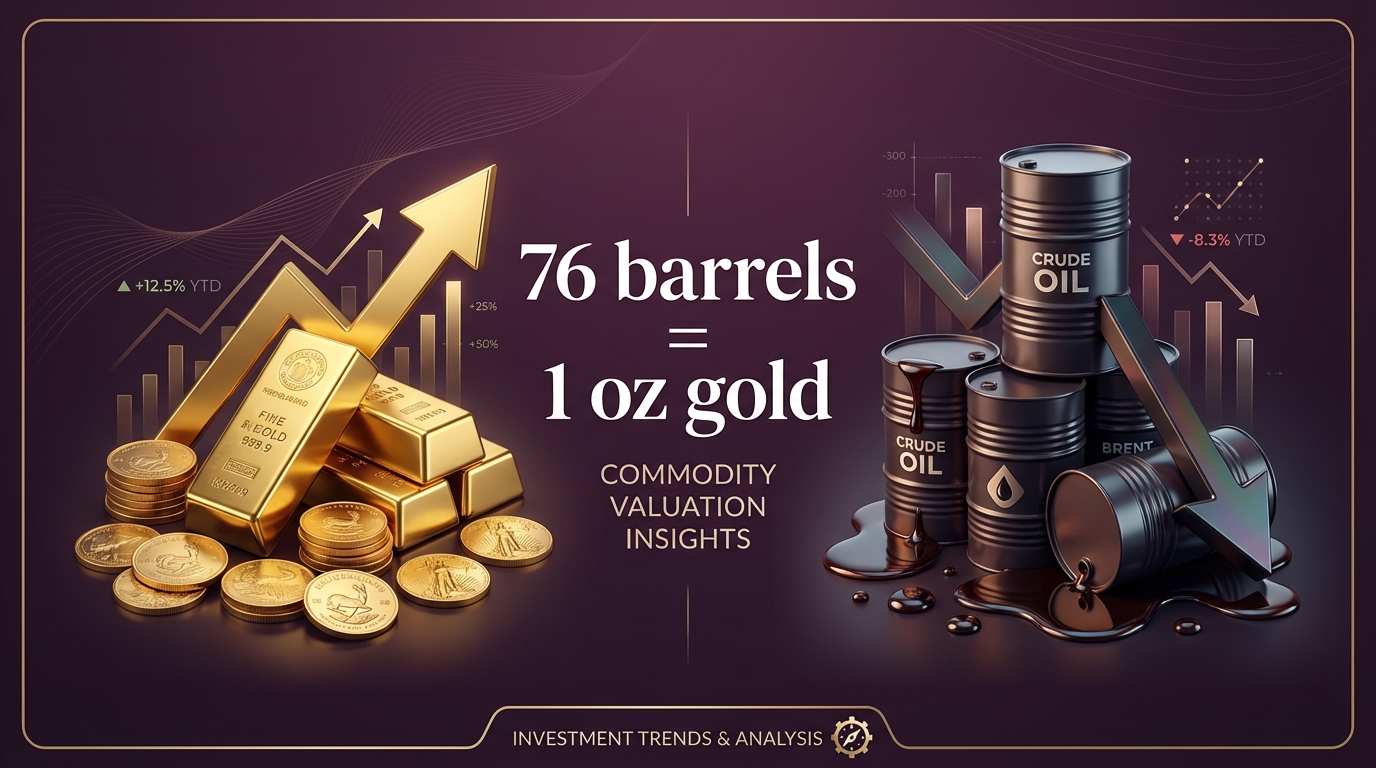
One ounce of gold now buys 76 barrels of oil. To put that in perspective, the historical average since 1946 is just 16-17 barrels per ounce of gold, according to MacroTrends historical data. This isn’t just an interesting statistic—it’s one of the most extreme divergences in commodity history, and it’s happening right now.
With gold trading at approximately $4,525 per ounce according to Yahoo Finance—up 67% over the past year—and crude oil languishing at $59 per barrel—down 23% over the same period—investors are witnessing a tale of two commodities that couldn’t be more different.
Current Market Snapshot
| Commodity | Current Price | Weekly Change | 1-Year Change | Source |
|---|---|---|---|---|
| Gold Spot | $4,525/oz | +4.6% | +67.0% | Yahoo Finance |
| Silver Spot | $78.76/oz | +12.4% | +126% | Yahoo Finance |
| Crude Oil (WTI) | $59.12/barrel | +3.1% | -22.8% | Yahoo Finance |
| S&P 500 | $694.07 | +1.8% | +21.0% | Yahoo Finance |
| Gold/Oil Ratio | 76.5 barrels/oz | Extreme | 5x average | Calculated |
| Gold/Silver Ratio | 57.5 | Compressed | Normalized | Calculated |
The Gold-Oil Ratio: Understanding the Extreme
What Is the Gold-Oil Ratio?
The gold-oil ratio measures how many barrels of oil one ounce of gold can purchase. It’s a key indicator that commodity analysts use to assess relative valuations between these two critical resources.
According to MacroTrends, since 1946, one ounce of gold has historically bought an average of 16.49 barrels of oil. The ratio tends to mean-revert over time, making extreme readings potentially significant for investors.
Current Extreme: 76.5 Barrels Per Ounce
“The oil-to-gold ratio currently sits at 20% of its 25-year historical average, providing extraordinary validation of gold’s relative strength and pricing power whilst simultaneously identifying severe undervaluation in energy markets.”
This extreme ratio—76.5 vs. the 16-17 average—represents a 4-5x deviation from historical norms. Such deviations have historically preceded significant mean reversion, though the direction and timing are always uncertain.
Historical Precedents
| Period | Gold/Oil Ratio | Context |
|---|---|---|
| 2020 COVID Crash | 40+ barrels | Oil went negative briefly |
| 2008 Financial Crisis | 25+ barrels | Flight to safety |
| 1998 Oil Glut | 28 barrels | Oil at historic lows |
| Today (Jan 2026) | 76.5 barrels | All-time extreme |
| Historical Average | 16.5 barrels | Long-term mean |
Sources: MacroTrends, LongTermTrends
Why Gold Is Winning: 5 Key Drivers
1. Central Bank Buying Reaches Record Levels
According to the World Gold Council, central banks have been net buyers of gold for over a decade, with 2024 and 2025 seeing particularly strong accumulation. This structural demand has no equivalent in oil markets.
Central Bank Gold Purchases:
- 2024: 1,037 tonnes (second-highest on record)
- 2025: On pace for another 900+ tonnes
- Key buyers: China, India, Turkey, Poland
As noted by DWS Research:
“Gold at a five-year high vs oil reflects central bank de-dollarization and geopolitical hedging demand that oil simply doesn’t benefit from.”
2. Fed Rate Trajectory Supports Gold
The Federal Reserve cut rates to 3.50-3.75% in 2025, down from the 5.25-5.50% peak. According to Morningstar’s Fed outlook, markets expect the Fed to hold steady in January 2026 before potentially cutting further.
Lower rates reduce the opportunity cost of holding non-yielding gold, while oil prices are more directly impacted by economic growth expectations.
3. Geopolitical Premium for Gold
Gold benefits from uncertainty as a safe-haven asset. Current geopolitical tensions—from Middle East instability to US-China tensions—have consistently pushed capital toward gold.
Oil, paradoxically, has seen less of a geopolitical premium due to:
- Increased US shale production capacity
- OPEC+ supply discipline challenges
- Energy transition narratives
4. De-Dollarization Trends
As Reuters reported, the trend toward reducing dollar dependence in global trade has benefited gold as an alternative reserve asset. Oil, priced in dollars, doesn’t capture this same structural shift.
5. Energy Transition Narrative
The long-term outlook for oil demand faces headwinds from:
- Electric vehicle adoption
- Renewable energy growth
- Climate policy commitments
Gold faces no such existential demand questions—jewelry, investment, and central bank demand remain robust.
Why Oil Is Struggling: 4 Key Factors
1. Supply Overshadowing Demand
According to IG’s 2026 commodity outlook:
“Energy supply growth is overtaking demand, with WTI price projected to average $59 in 2026.”
Global oil supply has grown faster than demand, particularly with:
- US shale production resilience
- Non-OPEC supply growth
- OPEC+ compliance challenges
2. China Demand Concerns
China, the world’s largest oil importer, has shown slower-than-expected demand growth. Economic uncertainty in China weighs more heavily on oil than on gold, which benefits from Chinese gold jewelry and investment demand.
3. Electric Vehicle Disruption
EV sales continue to grow globally, representing a structural headwind for long-term oil demand. While this impact is gradual, it affects investor sentiment and oil price multiples.
4. Dollar Strength
When the US dollar strengthens, oil (priced in dollars) becomes more expensive for foreign buyers, dampening demand. Gold, while also dollar-denominated, often moves inversely to the dollar due to its monetary metal status.
Investment Implications: 3 Scenarios
Scenario 1: Gold Continues Outperforming
Probability: Moderate-to-high if current trends persist
Drivers:
- Continued central bank buying
- Further Fed rate cuts
- Elevated geopolitical tensions
- De-dollarization acceleration
Outcome: Gold could reach $5,000+ while oil remains range-bound at $55-65
Scenario 2: Mean Reversion via Oil Rally
Probability: Possible if global growth surprises
Drivers:
- Stronger-than-expected global GDP
- OPEC+ supply cuts take hold
- China demand recovers
- Energy transition slows
Outcome: Oil rebounds to $75-85, gold consolidates, ratio normalizes toward 50
Scenario 3: Mean Reversion via Gold Correction
Probability: Lower, but possible
Drivers:
- Inflation collapses below 2%
- Fed pivot to rate hikes
- Risk appetite surge
- Central bank selling
Outcome: Gold corrects to $3,800-4,000, ratio normalizes
What History Suggests
According to Touzi Boke’s analysis:
“As of December 2025, gold is considered expensive when compared to oil.”
However, “expensive” relative to oil doesn’t necessarily mean gold will fall—it could mean oil is poised to rise, or the relationship has fundamentally changed.
Portfolio Strategy: How to Position
The Case for Gold Over Oil
| Factor | Gold | Oil |
|---|---|---|
| Structural demand | Central banks, jewelry, investment | Facing transition headwinds |
| Correlation to stocks | Low/negative in crisis | More correlated to growth |
| Inflation hedge | Proven over centuries | Mixed record |
| Storage/holding cost | Minimal (digital) | Contango costs |
| Geopolitical premium | Beneficiary | Mixed |
Allocation Considerations
For most investors, gold’s role as a portfolio diversifier and crisis hedge makes it more suitable for long-term allocation than oil. Consider:
Gold allocation (5-15% of portfolio):
- Store of value function
- Crisis hedge
- Inflation protection
- Low correlation to other assets
Oil/energy allocation (0-5% if desired):
- Tactical, not strategic
- Requires active management
- More speculative in nature
- Better accessed via energy stocks than commodity
The Mean Reversion Trade
For sophisticated investors interested in the ratio normalization:
| Strategy | Approach | Risk Level |
|---|---|---|
| Long oil/short gold | Direct ratio trade | Very high |
| Long oil outright | Betting on oil rebound | High |
| Reduce gold allocation | Wait for better entry | Moderate |
| Maintain gold allocation | Stay the course | Conservative |
For most NRI investors, maintaining a steady gold allocation while ignoring short-term ratio fluctuations is the prudent approach.
India Context: Why Gold Matters More
Gold in Indian Households
India holds an estimated 25,000 tonnes of gold in private hands—worth approximately $3.6 trillion at current prices. This represents the world’s largest private gold holding, according to the World Gold Council.
For Indians, gold isn’t just an investment—it’s:
- Cultural wealth: Passed down through generations
- Wedding necessity: Central to matrimonial traditions
- Financial security: Emergency reserve trusted for centuries
- Inflation hedge: Rupee has depreciated significantly against gold
Oil’s Limited Role for Indian Families
While India is a major oil importer, individual Indian families rarely hold oil as an investment. The practical considerations favor gold:
| Factor | Gold for Indians | Oil for Indians |
|---|---|---|
| Cultural significance | Deep traditional value | None |
| Accessibility | Easy to buy, hold, gift | Complex, industrial |
| Storage | Simple, secure | Impractical |
| Liquidity | Excellent | Poor for retail |
| Gifting utility | Central to celebrations | N/A |
Rupee Hedge Benefit
Gold priced in INR has appreciated even more than in USD due to rupee depreciation. For NRIs holding dollars, gold purchases can later be utilized for Indian family occasions, benefiting from both gold appreciation and potential rupee weakness.
Looking Ahead: 2026 Forecasts
Gold Price Targets
| Institution | 2026 Target | Current Price | Upside |
|---|---|---|---|
| J.P. Morgan | $5,055 | $4,525 | +12% |
| Goldman Sachs | $4,900 | $4,525 | +8% |
| Bank of America | $4,800-5,000 | $4,525 | +6-11% |
| UBS | $4,800 | $4,525 | +6% |
Sources: Compiled from analyst reports
Oil Price Forecasts
| Institution | 2026 Average | Current | Change |
|---|---|---|---|
| Reuters Poll (Brent) | $62.23 | $59 WTI | +5% |
| EIA | $59 WTI | $59 | Flat |
| Goldman Sachs | $65-70 Brent | - | Moderate upside |
Gold-Oil Ratio Projection
If analyst targets prove accurate:
- Gold at $5,000 and oil at $65 = ratio of 77 (still elevated)
- Gold at $4,800 and oil at $70 = ratio of 69 (slight normalization)
The extreme ratio may persist through 2026 unless oil sees a significant recovery.
Key Takeaways
-
The gold-oil ratio of 76.5 is historically extreme—nearly 5x the long-term average of 16-17 barrels per ounce
-
Gold is winning due to structural factors: Central bank buying, de-dollarization, Fed policy, and geopolitical demand
-
Oil faces headwinds: Supply growth, EV transition narrative, and China demand concerns
-
Mean reversion could happen either way: Gold correction, oil rally, or the relationship has fundamentally shifted
-
For most investors, gold remains the better long-term hold: Better portfolio diversification, crisis hedge, and store of value characteristics
-
For NRIs, gold serves multiple purposes: Investment, cultural tradition, and family gifting that oil cannot match
-
2026 outlook favors gold: Most analysts project further gold upside while oil remains range-bound
Build Your Gold Position with MantraMint
Whether gold is “expensive” relative to oil or not, its role as a portfolio diversifier and store of value remains unchanged. MantraMint makes it simple for Indians in the USA to build gold positions systematically.
Why MantraMint for Commodity Exposure?
- Pure gold: 24K gold, not commodity ETFs or futures
- No rollover costs: Unlike oil futures, no contango drag
- Start small: Invest as little as $10
- Auto-invest: Dollar-cost average into gold weekly or monthly
- Cultural flexibility: Use your gold for family gifts and occasions
While commodity traders debate gold vs. oil ratios, you can focus on what matters: building lasting wealth in an asset with 5,000 years of proven value.
Start Building Gold Today — The commodity that never goes out of style.
Sources
- Yahoo Finance - Gold Futures (GC=F)
- Yahoo Finance - Silver Futures (SI=F)
- Yahoo Finance - Crude Oil Futures (CL=F)
- MacroTrends - Gold to Oil Ratio Historical Chart
- LongTermTrends - Gold to Oil Ratio
- Crux Investor - Gold-to-Oil Ratio 25-Year Extreme
- DWS - Gold-Oil Ratio Analysis
- Touzi Boke - Gold-Oil Ratio Analysis 2025
- World Gold Council - Gold Demand Trends
- Federal Reserve - Interest Rates (H.15)
- Morningstar - What’s Next for the Fed in 2026
- IG - Commodities Outlook 2026
- Reuters - Commodities Market
Ready to start investing in gold?
Join thousands of Indian families building wealth with Mantra Mint.
Get Started Free