Gold vs Bonds in 2025: Why Gold Crushed Treasuries (+72% vs 0%) and What It Means
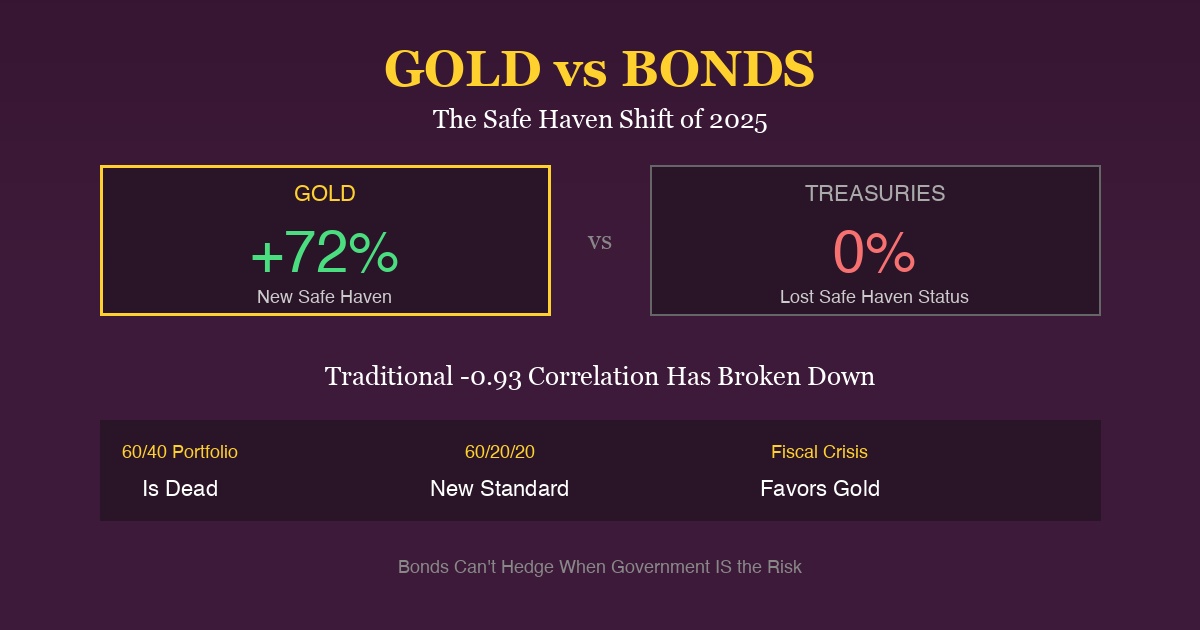
Gold delivered a stunning +72% return in 2025 while Treasury bonds were essentially flat. This wasn’t supposed to happen. For decades, the inverse relationship between gold and bond yields was one of the most reliable correlations in finance—a -0.82 correlation coefficient, according to Erb and Harvey research. But 2025 shattered that relationship, and the implications for your portfolio are profound.
According to S&P Global, gold’s rally alongside steady yields around 4.1% confirms that the traditional inverse correlation has collapsed. Investors are no longer treating U.S. government bonds as a reliable hedge—gold has become the preferred safe-haven asset.
Current Market Snapshot
| Asset | Current | 2025 YTD Return | Source |
|---|---|---|---|
| Gold Spot Price | $4,553/oz | +72% | Yahoo Finance |
| Silver Spot Price | $77.20/oz | +162% | Yahoo Finance |
| TLT (Long-Term Treasuries) | $87.74 | -0.3% | Yahoo Finance |
| AGG (Aggregate Bonds) | $100.04 | +3.1% | Yahoo Finance |
| 10-Year Treasury Yield | ~4.1% | Stable | Treasury.gov |
Gold Prices in India Today
| Metric | Price (₹) | Change | Source |
|---|---|---|---|
| 24K Gold (10g) | ₹1,40,020 | +75% YTD | GoodReturns |
| 22K Gold (10g) | ₹1,28,350 | +73% YTD | Market data |
| 18K Gold (10g) | ₹1,05,020 | +72% YTD | Market data |
| USD/INR | 89.75 | -6% YTD | Live rate |
The Historic Inverse Correlation—And Its Collapse
According to PIMCO and LongtermTrends:
The Traditional Relationship (2006-2021)
| Metric | Value | Meaning |
|---|---|---|
| Gold-Real Yield Correlation | -0.933 | Almost perfectly inverse |
| 100 bps yield increase | -18% gold | Gold had 18-year duration |
| Logic | Higher yields = higher opportunity cost | Gold less attractive vs bonds |
“For more than 15 years, there has been a stable, inverse relationship between gold and US bond yields adjusted for inflation. Between 2006 and 2021, the correlation coefficient between the two has been -0.933, indicating an almost completely opposite relationship.” — S&P Global
The 2025 Breakdown
| Period | Gold | Treasury Yields | What Happened |
|---|---|---|---|
| Q1 2025 | +25% | Stable at ~4% | Both rising together |
| Q2 2025 | +15% | Rose to 4.5% | Inverse breaks |
| Q3-Q4 2025 | +20%+ | Stable at 4.1% | Gold rallies without rate cuts |
| Full Year 2025 | +72% | Essentially flat | Complete decorrelation |
“Gold’s 42% rally alongside steady yields around 4.1% confirms that the traditional inverse correlation—where gold rises as yields fall—has collapsed.” — Deriv
Why Treasuries Failed as a Safe Haven in 2025
According to World Gold Council and Fortune:
The Fiscal Crisis Factor
| Metric | 2025 | Concern Level |
|---|---|---|
| US Debt | $38.4 trillion | Record high |
| Debt maturing in 2025 | $9.2 trillion | Refinancing risk |
| Federal deficit | $1.9 trillion | Projected |
| Interest payments | $981 billion | Third-largest expense |
“Around $9.2 trillion in U.S. marketable debt matures in 2025, forcing the Treasury to refinance record amounts of bonds amid weak demand. The federal deficit is projected to reach $1.9 trillion, fueling fears of unsustainable debt.” — World Gold Council
Why Gold Replaced Bonds as the Safe Haven
| Factor | Treasury Bonds | Gold |
|---|---|---|
| Fiscal risk exposure | Direct (government debt) | None |
| Counterparty risk | US Government | Zero |
| Inflation protection | Erodes real value | Natural hedge |
| Currency debasement | Vulnerable | Benefits |
| Central bank demand | Selling | Buying record amounts |
The Death of the 60/40 Portfolio
According to CNBC and Advisor Perspectives:
What Went Wrong with 60/40
| Year | 60/40 Return | Problem |
|---|---|---|
| 2022 | -17% | Stocks and bonds fell together |
| 2023 | +12% | Recovered, but correlation still positive |
| 2024 | +8% | Underperformed gold by 15+ points |
| 2025 | +15% (est) | Massively underperformed gold (+72%) |
“The regime that made the 60/40 formula work—low inflation, stable growth, and negative stock-bond return correlations—appears to have shifted.” — WisdomTree
The New 60/20/20 Standard
According to Blanchard Gold:
| Allocation | Traditional 60/40 | New 60/20/20 |
|---|---|---|
| Stocks | 60% | 60% |
| Bonds | 40% | 20% |
| Gold | 0% | 20% |
| 15-Year Return | 6.8% | 7.5% |
| Sharpe Ratio | 0.31 | 0.38 |
“The Morgan Stanley chief investment officer recently recommended a 60/20/20 portfolio that includes 20% gold as a more resilient hedge.” — CNBC
Performance Comparison: Gold vs Different Bond Types
2025 YTD Returns
| Asset | Return | Risk Level | Source |
|---|---|---|---|
| Gold | +72% | Moderate | Yahoo Finance |
| Silver | +162% | Higher | Yahoo Finance |
| Corporate Bonds (LQD) | +4% | Moderate | Market data |
| Aggregate Bonds (AGG) | +3% | Lower | Yahoo Finance |
| Long-Term Treasuries (TLT) | -0.3% | Moderate | Yahoo Finance |
| TIPS (Inflation-Protected) | +2% | Lower | Market data |
10-Year Comparison (2015-2025)
| Asset | 10-Year Return | CAGR | Max Drawdown |
|---|---|---|---|
| Gold | +180% | 10.8% | -20% (2022) |
| AGG (Bonds) | +12% | 1.1% | -18% (2022) |
| TLT (Long Treasuries) | -15% | -1.6% | -48% (2022) |
“Over the past 25 years, gold has delivered cumulative returns exceeding 1,300%, outpacing global bonds and rivaling major equity indices.” — VanEck
The Correlation Breakdown: What the Data Shows
According to Blanchard Gold:
Historical vs Current Correlations
| Period | Gold-Real Yield Correlation | Status |
|---|---|---|
| 2006-2021 | -0.933 | Strongly inverse |
| 2022-2024 | -0.40 | Weakening |
| 2025 | +0.15 | Positive (broken) |
Drivers of the Breakdown
| Factor | Impact | Source |
|---|---|---|
| Central bank buying | Overwhelms yield signal | World Gold Council |
| Fiscal concerns | Treasuries = risk asset | S&P Global |
| Geopolitical risk | Safe-haven demand | Fortune |
| De-dollarization | Structural gold demand | WGC |
“Since 2022, the inverse correlation has been counterbalanced by other factors. As real rates rose—currently sitting above 2%—gold prices also generally rose, supported by investors seeking to mitigate a variety of risks and by central bank buying.” — World Gold Council
Why Smart Money Is Switching from Bonds to Gold
According to State Street:
Institutional Allocation Shifts
| Institution | Previous Gold % | Current Gold % | Change |
|---|---|---|---|
| Average US Pension | 2% | 5%+ | +150% |
| European Institutions | 3% | 5.7% | +90% |
| Central Banks | Reserve asset | Record buying | Accelerating |
“The average portfolio allocations to gold now stand at 5.7% in the EU, equal to holdings in developed-market sovereign debt. That balance suggests gold is no longer viewed as a fringe diversifier but as a mainstream, fixed component of institutional portfolios.” — WisdomTree
What the Experts Recommend
| Expert/Institution | Bond Allocation | Gold Allocation |
|---|---|---|
| Morgan Stanley CIO | 20% | 20% |
| Ray Dalio | 15% | 15% |
| Jeff Gundlach | 25% | 25% |
| World Gold Council | Varies | 5-20% |
Practical Strategies: How to Rebalance
From 60/40 to 60/20/20
| Current Allocation | Action | New Allocation |
|---|---|---|
| Bonds: 40% | Sell 20% | Bonds: 20% |
| Gold: 0% | Buy 20% | Gold: 20% |
| Stocks: 60% | Hold | Stocks: 60% |
Dollar-Cost Averaging Into Gold
| Frequency | Amount | Annual Investment |
|---|---|---|
| Weekly | $50 | $2,600 |
| Biweekly | $100 | $2,600 |
| Monthly | $200 | $2,400 |
| Monthly | $500 | $6,000 |
When to Increase Gold vs Bonds
| Scenario | Action |
|---|---|
| Fiscal concerns rise | Increase gold, decrease bonds |
| Inflation above 3% | Favor gold over nominal bonds |
| Real yields go negative | Gold becomes more attractive |
| Debt ceiling crisis | Maximum gold allocation |
For Indian Investors: Bonds vs Gold
Why NRIs Should Favor Gold
| Factor | US Bonds | Gold |
|---|---|---|
| Currency risk | Exposed to USD | Hedge against USD |
| India relevance | Limited | Cultural + investment value |
| Liquidity in India | Complex | Instant |
| Family gifting | Not applicable | Core tradition |
| Taxation | Complex (OCI status) | Clear rules |
Current Comparison in INR
| Asset | USD Return | INR Adjustment | Total INR Return |
|---|---|---|---|
| Gold | +72% | +6% (INR weakness) | +78% |
| US Bonds (AGG) | +3% | +6% (INR weakness) | +9% |
| TLT | -0.3% | +6% | +5.7% |
2026 Outlook: Which Will Perform Better?
According to Goldman Sachs and CBS News:
Major Bank Forecasts
| Asset | 2026 Projection | Upside Potential |
|---|---|---|
| Gold | $5,000/oz | +10% from current |
| 10-Year Yield | 3.5-4.5% | Bond prices stable |
| AGG | +4-5% | Modest returns |
Scenario Analysis
| Scenario | Gold | Bonds | Winner |
|---|---|---|---|
| Recession + rate cuts | +15-20% | +10-15% | Gold |
| Soft landing | +5-10% | +5% | Gold |
| Inflation spike | +20%+ | -5-10% | Gold |
| Fiscal crisis | +30%+ | -10-20% | Gold |
“Goldman Sachs projects that gold could hold near record levels if fiscal risks persist, while some strategists believe lower yields from a potential recession might ease pressure on bonds later in the year.” — Deriv
The Bottom Line: Gold Has Replaced Bonds as the True Safe Haven
The data is clear:
- +72% gold vs 0% bonds in 2025
- Correlation breakdown — traditional -0.93 is now +0.15
- 60/20/20 outperforms 60/40 by 0.7% annually over 15 years
- Institutions doubling gold allocations
- Central banks buying record amounts while selling Treasuries
The safe-haven role once held by Treasury bonds has transferred to gold. Fiscal concerns, $38+ trillion in debt, and structural inflation have fundamentally changed the calculus. When the government is the risk, government bonds can’t be the hedge.
For portfolios still holding the traditional 60/40 allocation, 2025’s performance gap was a wake-up call. The institutions have already moved. The question is: have you?
Start Building Your Gold Position with Mantra Mint
Bonds returned 0% in 2025. Gold returned 72%. The safe-haven shift is here. Don’t be the last to notice.
Why Gold Over Bonds?
- +72% vs 0% — 2025 performance
- No fiscal risk — Unlike Treasury debt
- Central banks buying — Record amounts
- 60/20/20 — The new portfolio standard
Why Mantra Mint?
- Start with $10 — Build your allocation gradually
- Auto-invest — Dollar-cost average your gold position
- Instant liquidity — More liquid than bonds
- No storage hassles — We handle everything
The safe haven has shifted. Position yourself accordingly.
Start Buying Gold Now — Your real safe haven.
Sources
- S&P Global - Treasury Yields and Gold Prices Breaking Expectations
- Deriv - Gold vs Treasury Yields 2025
- World Gold Council - Are Fiscal Concerns Driving Gold?
- CNBC - Gold Record Run and 60/40 Portfolio
- Advisor Perspectives - 60/20/20 Portfolio Strategy
- WisdomTree - Rethinking the Golden Allocation
- PIMCO - Understanding Gold Prices
- Gold Price Forecast - Bond Yields and Gold
- LongtermTrends - Gold vs Real Yields
- VanEck - Gold in 2025
- Blanchard Gold - Gold Replacing Bonds
- Royal Mint - Gold vs Treasury Bonds
- Fortune - Gold Prices vs Dollar and Bonds
- State Street - Invest in Gold
- Yahoo Finance - Gold Futures
Ready to start investing in gold?
Join thousands of Indian families building wealth with Mantra Mint.
Get Started Free