Gold Technical Analysis December 2025: Key Levels to Watch as Price Tests All-Time Highs
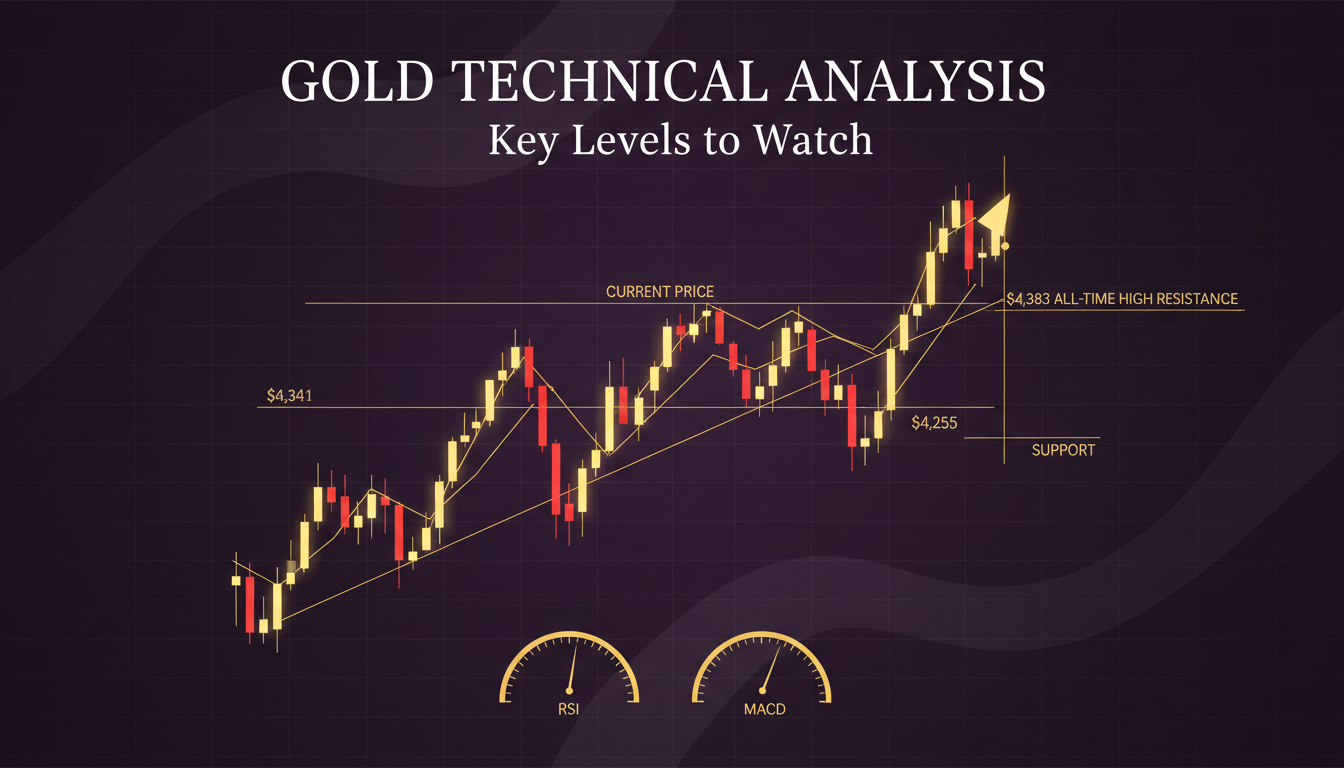
Gold is knocking on the door of its all-time high. Trading at $4,341 per ounce as of December 16, 2025, according to Yahoo Finance, gold sits just 1% below its October peak of $4,383. For traders and investors alike, understanding the technical levels becomes critical at these elevated prices.
This comprehensive technical analysis breaks down the key support and resistance levels, moving average signals, and chart patterns that will determine gold’s next major move.
Current Market Snapshot
| Metric | Value | Signal | Source |
|---|---|---|---|
| Gold Spot Price | $4,341/oz | +3.2% weekly | Yahoo Finance |
| Silver Spot Price | $62.77/oz | +9.4% weekly | Yahoo Finance |
| Gold/Silver Ratio | 69.2 | Below average | Calculated |
| Gold Futures (GC=F) | $4,357.60 | Near ATH | Yahoo Finance |
| All-Time High | $4,383 | Oct 20, 2025 | World Gold Council |
Moving Average Analysis: Strong Buy Signals
All major moving averages are generating buy signals, indicating sustained upward momentum. According to Investing.com’s technical analysis:
Moving Average Summary
| Moving Average | Simple | Exponential | Signal |
|---|---|---|---|
| MA50 | $4,342 | $4,326 | Buy |
| MA100 | $4,307 | $4,311 | Buy |
| MA200 | $4,271 | $4,282 | Buy |
The fact that gold trades above all major moving averages is a strongly bullish signal. According to the World Gold Council’s October 2025 commentary:
“Gold traded more than 25% above its long-term 200-day average during its October peak—a historically stretched condition.”
Currently, gold sits approximately 2.5% above its 200-day moving average of $4,271, suggesting the uptrend remains healthy without being excessively stretched.
Golden Cross Status
The 50-day MA ($4,342) remains well above the 200-day MA ($4,271), maintaining the “Golden Cross” bullish configuration that formed earlier in 2025. This long-term bullish signal has been in place throughout gold’s historic 61% rally.
Key Support and Resistance Levels
According to LiteFinance technical analysis and RoboForex forecasts:
Critical Price Levels
| Level Type | Price | Significance |
|---|---|---|
| Resistance 3 | $4,441 | Upper target zone |
| Resistance 2 | $4,383 | All-time high |
| Resistance 1 | $4,374 | Evening Star pattern high |
| Current Price | $4,341 | Trading level |
| Pivot Point | $4,335 | Daily pivot |
| Support 1 | $4,327 | Near-term floor |
| Support 2 | $4,255 | Key Fibonacci level |
| Support 3 | $4,202 | Strong support |
| Support 4 | $4,157 | Major support |
| Support 5 | $4,114 | Critical floor |
Fibonacci Retracement Levels
According to Investing.com’s Fibonacci analysis:
| Fibonacci Level | Price | Significance |
|---|---|---|
| 138.2% Extension | $4,500 | Major resistance zone |
| Current | $4,341 | Trading level |
| 23.6% Retracement | $4,124 | First major support |
| 38.2% Retracement | $4,000 | Psychological support |
| 55-Day Average | ~$3,800 | Medium-term support |
| 61.8% Retracement | $3,024 | Strong support |
Per the World Gold Council:
“First key technical support is seen around the 55-day average and initial Fibonacci retracement of the rise from the 2022 low, both near US$3,800/oz.”
Technical Indicators Analysis
RSI (Relative Strength Index)
| Timeframe | RSI Value | Interpretation |
|---|---|---|
| 14-Period | 64.19 | Bullish, approaching overbought |
| Weekly | 66 | Near upper boundary |
According to LiteFinance:
“RSI is near the upper boundary at 66, and it may reverse to the downside.”
The RSI reading of 64 suggests gold is in bullish territory but not yet overbought (above 70). This indicates room for further upside before a technical correction becomes likely.
MACD (Moving Average Convergence Divergence)
| Indicator | Value | Signal |
|---|---|---|
| MACD Line | -3.66 | Below signal line |
| Signal | Bearish divergence | Weakening momentum |
| Histogram | Declining | Caution warranted |
The MACD has crossed below its signal line, per Investing.com, suggesting short-term momentum is weakening even as price remains elevated. This divergence often precedes consolidation periods.
Stochastic RSI
| Indicator | Value | Signal |
|---|---|---|
| Stochastic RSI | 100 | Overbought |
| %K | 100 | Maximum |
| %D | 98.5 | Extreme |
The Stochastic RSI at 100 indicates an overbought condition, suggesting a short-term pullback is possible before the next leg higher.
Chart Patterns to Watch
Current Pattern: Evening Star Doji
According to LiteFinance’s 4-hour chart analysis:
“An Evening Star Doji reversal pattern has formed in the $4,313.67-$4,373.89 range.”
Implications:
- This bearish reversal pattern suggests potential short-term weakness
- Key support at $4,255 must hold to maintain bullish structure
- A break above $4,374 would negate the pattern
Ascending Channel
According to RoboForex analysis:
“Gold remains within a broader ascending channel, indicating the longer-term trend remains upward despite current sideways consolidation.”
The ascending channel has defined gold’s 2025 rally, with price consistently making higher highs and higher lows.
Bollinger Bands
The analysis identifies a “Shooting Star reversal pattern near the upper Bollinger Band,” suggesting potential downward pressure in the near term.
December 2025 Price Forecast
Short-Term Outlook (This Week)
| Metric | Forecast | Source |
|---|---|---|
| Daily Low | $4,202 | LiteFinance |
| Daily High | $4,374 | LiteFinance |
| Week Average | $4,288 | Calculated |
December Month-End Targets
| Institution | Target Range | Methodology |
|---|---|---|
| Long Forecast | $4,408 | Technical projection |
| LiteFinance | $4,310-$4,340 | Technical analysis |
| CoinCodex | $4,440 (Dec 21) | Algorithm prediction |
According to Long Forecast:
“Gold price forecast for December 2025: High price $4,669, low $4,113. At the end of December $4,408, change +3.6%.”
Trading Scenarios
Bullish Scenario
Trigger: Break above $4,383 (all-time high)
| Target | Price | Probability |
|---|---|---|
| Target 1 | $4,420 | High |
| Target 2 | $4,500-$4,520 | Medium |
| Target 3 | $4,675 | Low (extended) |
Per the World Gold Council:
“Technical resistance levels above the US$4,382/oz peak are seen at US$4,420/oz, then US$4,500/oz-US$4,520/oz, ahead of US$4,675/oz.”
Bearish Scenario
Trigger: Break below $4,255 support
| Target | Price | Probability |
|---|---|---|
| Target 1 | $4,202 | High |
| Target 2 | $4,157 | Medium |
| Target 3 | $4,114 | Low |
| Target 4 | $4,000 | Very Low |
According to RoboForex:
“A downward correction to $4,175 USD before resuming the broader uptrend is the primary scenario.”
Consolidation Scenario (Most Likely)
Range: $4,255-$4,383
Given the overbought Stochastic RSI and MACD divergence, consolidation between support and resistance is the most probable near-term outcome before the next directional move.
Key Events to Watch
| Date | Event | Potential Impact |
|---|---|---|
| Dec 16 | US Manufacturing PMI | Medium |
| Dec 18 | November CPI Release | High |
| Dec 19 | Bank of Japan Decision | Medium |
| Dec 20 | PCE Inflation | High |
| Dec 25 | Markets Closed | N/A |
The November CPI release on December 18 is particularly important after October’s data was cancelled due to the government shutdown.
Volume and Momentum Analysis
Money Flow Index (MFI)
According to LiteFinance:
“MFI declining alongside volume, showing liquidity outflow.”
This suggests institutional money may be taking profits at current levels, which aligns with the consolidation thesis.
Volume Profile
Key observations:
- Volume has declined from October’s all-time high surge
- Current volume is average, suggesting neither accumulation nor distribution
- A volume spike would confirm the next directional move
2025 Performance Context
Gold’s technical position must be understood within its remarkable 2025 performance:
| Metric | Value | Context |
|---|---|---|
| YTD Return | +61% | Fourth strongest since 1971 |
| All-Time Highs | 50+ | Record number |
| Best Quarter | Q4 | Current |
| Days Above 200-MA | All of 2025 | Sustained uptrend |
According to Investinghaven:
“After setting more than 50 all-time highs and edging over 60% by the end of November, gold has emerged as one of the strongest performing assets in 2025.”
What This Means for NRI Investors
Technical Entry Points
| Strategy | Entry Level | Stop Loss | Target |
|---|---|---|---|
| Conservative | $4,255 (support) | $4,157 | $4,383 |
| Moderate | Current ($4,341) | $4,255 | $4,500 |
| Aggressive | $4,383 breakout | $4,327 | $4,675 |
Dollar-Cost Averaging Approach
For long-term investors, the technical analysis suggests:
- Continue regular purchases - The trend remains bullish
- Don’t chase breakouts - Wait for pullbacks to support
- Set alerts at key levels - $4,255, $4,383, $4,500
- Avoid timing the market - Systematic investing reduces risk
India Gold Price Context
With gold at approximately 1,35,500 rupees per 10 grams in India, NRIs should note:
- Import duty at 6% (lowest in over a decade)
- Wedding season demand supporting prices
- RBI continues accumulating gold reserves
- Technical breakout above 1,40,000 rupees would be significant
Long-Term Technical Outlook
2026 Targets from Major Institutions
| Institution | Target | Timeline | Source |
|---|---|---|---|
| Goldman Sachs | $4,900 | Dec 2026 | Goldman Sachs |
| J.P. Morgan | $4,000+ | Mid-2026 | J.P. Morgan |
| HSBC | $5,000 | H1 2026 | HSBC Research |
| World Gold Council | +5-15% | 2026 | WGC |
Secular Bull Market Intact
According to the World Gold Council’s October commentary:
“No long-term momentum ‘sell’ signals seen thus far. The October decline represents a healthy and much needed breather in the core long-term uptrend rather than a reversal.”
Key Takeaways
Bullish Signals:
- All major moving averages (50, 100, 200-day) generating buy signals
- Price maintains ascending channel structure
- Golden Cross remains intact
- RSI bullish but not extreme
Caution Signals:
- MACD below signal line (weakening momentum)
- Stochastic RSI overbought at 100
- Evening Star Doji pattern forming
- Money Flow Index declining
Key Levels to Watch:
- Resistance: $4,374, $4,383 (ATH), $4,420, $4,500
- Support: $4,327, $4,255, $4,202, $4,157
Most Likely Scenario: Consolidation between $4,255-$4,383 before the next directional move, with the longer-term trend remaining bullish.
Start Your Gold Journey with Mantra Mint
Whether you’re a technical trader looking to time entries or a long-term investor building wealth, Mantra Mint makes gold investing simple for Indians in the USA.
Why Mantra Mint?
- Start small: Buy as little as $10 in 24K gold
- No timing needed: Set up auto-invest to dollar-cost average
- Gift gold: Send gold to family for weddings and festivals
- Instant liquidity: Sell whenever you need to
The technical picture is clear: gold’s long-term uptrend remains intact. Don’t wait for the “perfect” entry—systematic investing smooths out short-term volatility.
Start Buying Gold Today — Lock in your position in this historic bull market.
Sources
- Yahoo Finance - Gold Futures (GC=F)
- Yahoo Finance - Silver Futures (SI=F)
- Investing.com - Gold Futures Technical Analysis
- LiteFinance - Gold Price Forecast Daily and Weekly
- RoboForex - Gold Forecast December 2025
- World Gold Council - Gold Market Commentary October 2025
- World Gold Council - Gold Outlook 2026
- Investing.com - Gold Fibonacci Map Analysis
- Long Forecast - Gold Price Forecast 2025
- CoinCodex - Gold Price Predictions
- J.P. Morgan - Gold Price Research
- DailyForex - Gold Analysis December 2025
Ready to start investing in gold?
Join thousands of Indian families building wealth with Mantra Mint.
Get Started Free