Gold Supply and Demand 2025: Record-Breaking Forces Driving Prices Higher
Gold has entered uncharted territory in 2025. With prices surging above $4,300 per ounce—up over 60% year-to-date—and demand hitting all-time records, understanding the supply and demand dynamics has never been more critical for investors.
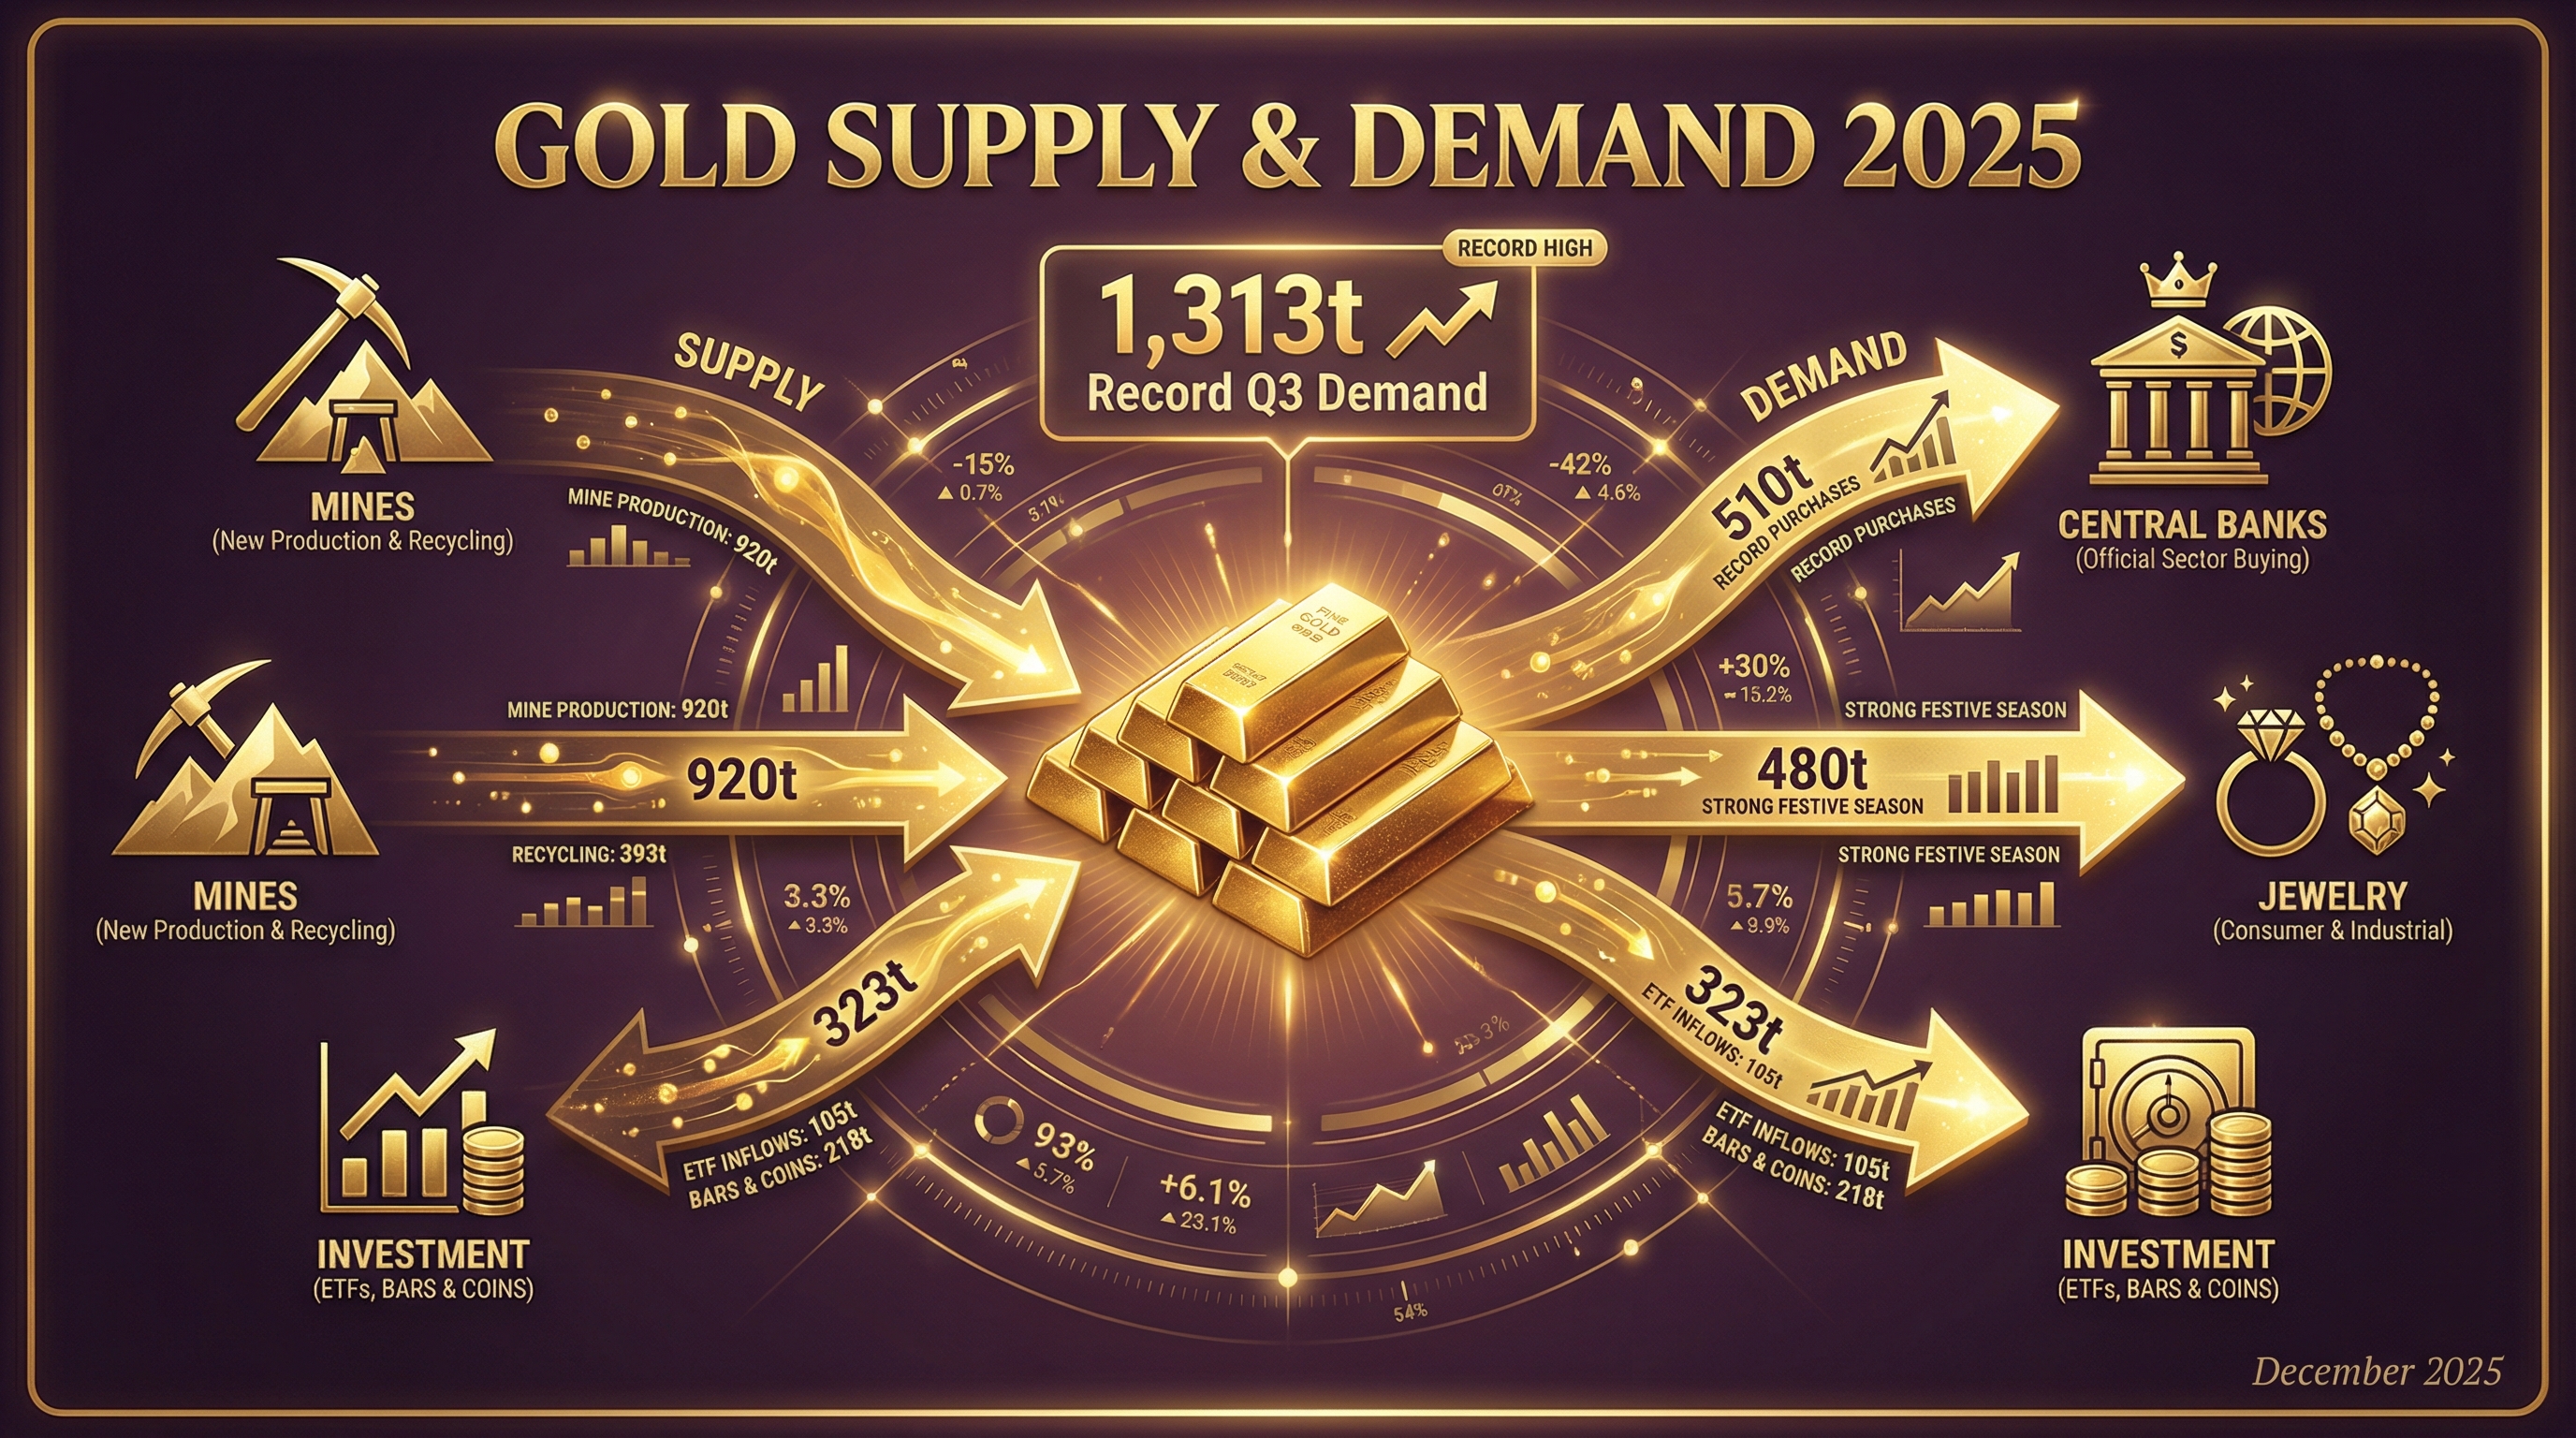
According to the World Gold Council’s Q3 2025 report, total gold demand reached a record 1,313 tonnes in Q3 alone, valued at an unprecedented $146 billion. This comprehensive analysis breaks down exactly what’s driving this historic bull market.
Current Market Snapshot
| Metric | Value | Change | Source |
|---|---|---|---|
| Gold Price | $4,321/oz | +61% YTD | Yahoo Finance |
| Silver Price | $63.23/oz | +114% YTD | Yahoo Finance |
| Gold/Silver Ratio | 68.3 | Historic low | Calculated |
| Q3 2025 Demand | 1,313 tonnes | +3% YoY | World Gold Council |
| Q3 2025 Demand Value | $146 billion | +44% YoY | World Gold Council |
| Q3 Mine Production | 977 tonnes | +2% YoY | World Gold Council |
The Supply Side: Record Mining, But Can It Keep Up?
Mining Production Hits New Highs
According to the World Gold Council, gold mining is on track for a potential record year:
| Quarter | Mine Production | YoY Change | Notes |
|---|---|---|---|
| Q1 2025 | 856 tonnes | +1% | Q1 record |
| Q2 2025 | 909 tonnes | All-time Q2 high | New quarterly record |
| Q3 2025 | 977 tonnes | +2% | Seasonal peak |
| Full Year Projection | ~3,700 tonnes | — | Potential record |
Per the World Gold Council:
“Full year 2025 may see a new record high in gold production, eclipsing the previous high set in 2018. Growth from ramp-ups and new projects led by Ghana, Canada, and Australia could take production to a new record.”
Top Gold Mining Companies (H1 2025)
According to Mining.com:
| Rank | Company | Production (H1 2025) | YoY Change |
|---|---|---|---|
| 1 | Newmont Corporation | 3,383 koz | -5% |
| 2 | Agnico Eagle Mines | 1,740 koz | +8% |
| 3 | Barrick Mining | 1,555 koz | -16.7% |
| 4 | Navoi Mining | 1,538 koz | +1.6% |
| 5 | AngloGold Ashanti | 1,524 koz | +21.5% |
Newmont maintains its top position despite selling non-core assets, while Barrick dropped to third place following the seizure of its Loulo-Gounkoto mine by Mali’s government.
Mining Costs at Record Highs
| Metric | Q1 2025 | Q2 2025 | Change |
|---|---|---|---|
| Average AISC | $1,536/oz | $1,424/oz | -7% q/q |
| YoY AISC Change | +11% | — | Record high in Q1 |
| Profit Margin | ~$2,785/oz | ~$2,897/oz | Expanding |
Despite record costs, gold miners are enjoying their best margins in history thanks to the price surge.
Recycled Gold Supply
Recycled gold remains elevated but stable:
| Quarter | Recycled Gold | YoY Change |
|---|---|---|
| Q2 2025 | 347 tonnes | Highest Q2 since 2011 |
| Q3 2025 | 344 tonnes | +6% YoY |
Consumers are holding onto gold hoping for higher prices, limiting recycling growth despite record prices.
The Demand Side: Four Pillars Driving Prices
1. Central Bank Buying: The Unstoppable Force
Central banks have emerged as the dominant force in gold markets. According to Bloomberg and the World Gold Council:
| Period | Central Bank Purchases | Key Buyers |
|---|---|---|
| Q1 2025 | 244 tonnes | Poland, China, Czech Republic |
| Q2 2025 | 166 tonnes | Turkey, India, Kazakhstan |
| Q3 2025 | 220 tonnes | Kazakhstan, Brazil, Poland |
| 2025 Projected | ~900 tonnes | Fourth consecutive 1,000t+ year |
“Central banks are accumulating roughly 80 metric tons of gold a month, worth about $8.5 billion at current prices.”
Top Central Bank Buyers in 2025:
| Country | 2025 Purchases | Total Holdings | Share of Reserves |
|---|---|---|---|
| Poland | 67 tonnes YTD | 515 tonnes | 22% |
| China | 10 consecutive months | 2,300+ tonnes | — |
| Czech Republic | 30-month streak | 65 tonnes | Target: 100t by 2028 |
| Brazil | First purchases in 4+ years | — | — |
According to the World Gold Council’s survey:
“43% of central banks anticipate an increase in their own gold holdings—up from 29% in 2024—a record high.”
2. ETF Inflows: Western Investors Return
After years of outflows, gold ETFs are experiencing massive inflows. According to ETF.com and the World Gold Council:
| Metric | Value | Context |
|---|---|---|
| 2025 Global Inflows | $57.1 billion | Near 2020 record |
| US-Listed ETF Inflows | $32.7 billion | Leading the charge |
| GLD 2025 Inflows | $12.9 billion | On pace for record |
| GLD Largest Single-Day Inflow | $2.2 billion | 21-year record (Dec 2025) |
| Global Holdings | 3,893 tonnes | 2% below 2020 peak |
| Total AUM | $503 billion | Record high |
Per ETF.com:
“Remarkably, the three biggest daily inflows GLD has ever seen have all occurred this year.”
3. Investment Demand: Bars and Coins Surge
According to the World Gold Council:
| Quarter | Bar & Coin Demand | YoY Change |
|---|---|---|
| Q1 2025 | 310+ tonnes | — |
| Q2 2025 | 300+ tonnes | — |
| Q3 2025 | 316 tonnes | Fourth quarter above 300t |
Regional Investment Trends:
| Region | Trend | Notes |
|---|---|---|
| China | Bars/coins now 60%+ of demand | Shift from jewelry |
| India | Bars/coins at 35% of demand | Up from 25% historical |
| USA | Strong retail demand | Driven by inflation hedge |
Per the World Gold Council:
“Over the past 15 years, demand for gold coins and small bars in China and India averaged around 25% of their households’ combined gold product demand. But at the start of 2025, that percentage leapt, topping 50%.“
4. Jewelry Demand: Price Sensitivity Emerges
Jewelry demand has softened as prices soared past psychological barriers. According to BullionVault and the World Gold Council:
India:
| Metric | Value | Context |
|---|---|---|
| H1 2025 Jewelry Demand | 160 tonnes | Second lowest since 2000 |
| Q2 2025 Demand | 89 tonnes | -17% YoY |
| 2025 Full Year Projection | 700-800 tonnes | Down from 802.8t in 2024 |
| Current Dealer Discount | Up to $34/oz | Wedding season softness |
Per Business Standard:
“Gold discounts in India widened this week as demand fell despite the wedding season after prices scaled record highs.”
China:
| Metric | Value | Context |
|---|---|---|
| 2024 Jewelry Demand | -27.53% YoY | Significant decline |
| Investment Share | 60%+ of total | Shift from jewelry |
| Dealer Pricing | $20 discount to $10 premium | Volatile |
Adaptation Trends:
- Consumers favoring lighter-weight items
- 18k plain gold jewelry gaining popularity
- Gold-plated silver jewelry acceptance growing
Supply vs. Demand: The Structural Deficit
The Math Doesn’t Work
| Category | Q3 2025 | Quarterly Trend |
|---|---|---|
| Total Supply | 1,313 tonnes | +3% YoY |
| Mine Production | 977 tonnes | +2% |
| Recycled Gold | 344 tonnes | +6% |
| Total Demand | 1,313 tonnes | +3% YoY |
| Investment (ETF + Bars/Coins) | 538 tonnes | +170% YoY |
| Central Banks | 220 tonnes | +28% q/q |
| Jewelry | ~480 tonnes | -15% YoY |
| Technology | ~75 tonnes | Stable |
The market is essentially in balance on tonnage, but the value measure tells a different story:
- Q3 2025 demand value: $146 billion (+44% YoY)
- Highest quarterly value ever recorded
- Price appreciation absorbing supply growth
Why Prices Keep Rising
Three structural factors explain the bull market:
- Central bank accumulation is price-insensitive - They’re buying for strategic reserves, not profit
- ETF demand is momentum-driven - Inflows accelerate as prices rise
- Supply is capped - Mining can’t increase fast enough to meet demand
What This Means for NRI Investors
The Holiday Gifting Angle
With India’s wedding season in full swing (November-March) and holiday gifting peaking, understanding supply/demand helps inform buying decisions:
| Factor | Implication | Strategy |
|---|---|---|
| Strong central bank demand | Price floor established | Don’t wait for major dips |
| ETF inflows accelerating | Momentum likely to continue | Dollar-cost average |
| India jewelry demand soft | Better deals at jewelers | Take advantage of discounts |
| Supply constrained | Long-term bullish | Build position over time |
Portfolio Allocation by Expert Recommendations
| Expert/Institution | Gold Allocation | Rationale |
|---|---|---|
| Ray Dalio (Bridgewater) | 15% | Hedge against credit risk |
| World Gold Council | 5-10% | Optimal diversification |
| BlackRock | 2-5% | Near-term hedge |
| Goldman Sachs | Target: $4,900 | Structural central bank demand |
India-Specific Opportunity
Despite record prices, the wedding season creates unique dynamics:
- Dealer discounts up to $34/oz in India
- Import duty remains at 6% (lowest in decade)
- RBI continues accumulating (57+ tonnes in FY25)
- Digital gold platforms offer instant access
2026 Outlook: Where Supply and Demand Head Next
World Gold Council Projections
According to the World Gold Council’s 2026 Outlook:
| Factor | 2026 Expectation |
|---|---|
| Central bank buying | Remains elevated at 900+ tonnes |
| ETF flows | Continued inflows as rates fall |
| Jewelry demand | Gradual recovery if prices stabilize |
| Mine production | Potential new record |
| Overall balance | Tight supply/demand |
Price Targets from Major Banks
| Institution | Target | Timeline |
|---|---|---|
| Goldman Sachs | $4,900 | Dec 2026 |
| HSBC | $5,000 | H1 2026 |
| Bank of America | $4,800 | 12-month |
| Société Générale | $5,000 | End 2026 |
Key Takeaways
The gold market in 2025 is characterized by unprecedented dynamics:
- Record demand of 1,313 tonnes in Q3, worth $146 billion
- Central banks buying 80 tonnes monthly—price insensitive
- ETF inflows of $57 billion globally, near 2020 record
- Mine production potentially hitting all-time high
- Jewelry demand soft due to record prices
- Investment demand (bars/coins) now 50%+ of China/India demand
For NRI investors, the supply/demand picture is clear: structural demand from central banks and investors is overwhelming supply growth. While jewelry demand has softened, investment demand has more than compensated.
Mantra Mint makes it easy to participate in this historic gold market—buy, gift, and save digital gold with the confidence that comes from understanding the fundamental forces driving prices higher.
Sources
- World Gold Council - Gold Demand Trends Q3 2025
- World Gold Council - Gold Demand Trends Q2 2025
- World Gold Council - Gold Supply Data
- Yahoo Finance - Gold Futures (GC=F)
- Yahoo Finance - Silver Futures (SI=F)
- Bloomberg - Central Banks Step Up Gold Purchases
- World Gold Council - Central Bank Gold Statistics
- ETF.com - GLD Sees Record Inflows
- ETF.com - Global Gold ETF Inflows Hit $44B
- World Gold Council - Gold ETF Holdings and Flows
- Mining.com - Top 10 Gold Mining Companies 2025
- Business Standard - India Gold Discounts
- BullionVault - Record Gold Price Hits China, India
- World Gold Council - Gold Outlook 2026
- Kitco - Central Bank Gold Buying
Ready to start investing in gold?
Join thousands of Indian families building wealth with Mantra Mint.
Get Started Free