Gold & Silver Prices Today: December 28, 2025 - Historic Year-End Rally
Gold and silver are closing out 2025 with one of the most remarkable performances in precious metals history. As markets wind down for the holiday week, gold holds firmly above $4,500/oz while silver pushes toward $80—both setting up for annual gains that have shattered all expectations.
According to Bloomberg, the precious metals rally has gathered momentum through December, with gold, silver, and platinum all hitting all-time highs in what analysts are calling a “historic end-of-year surge.”
Current Prices: December 28, 2025
| Metal | Price | Weekly Change | YTD Change | Source |
|---|---|---|---|---|
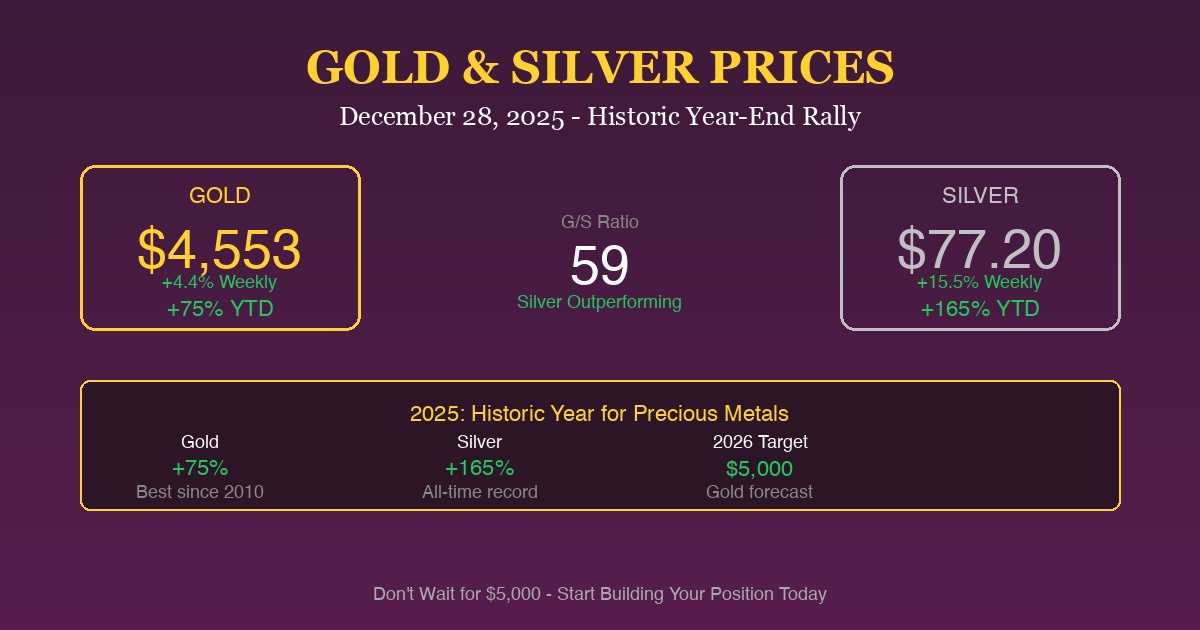
| Gold (XAU) | $4,553/oz | +4.4% | +74.7% | Yahoo Finance |
| Silver (XAG) | $77.20/oz | +15.5% | +165.2% | Yahoo Finance |
| Gold/Silver Ratio | 59.0 | -10.6% | -34% | Calculated |
| Fed Funds Rate | 3.50-3.75% | — | -175bps | Federal Reserve |
Year in Review: A Historic 2025
According to ABC News, gold has risen nearly 70% in 2025, far exceeding analyst predictions from January when most forecasts called for modest single-digit gains.
Gold’s Journey in 2025
| Quarter | Starting Price | Ending Price | Key Driver |
|---|---|---|---|
| Q1 | $2,600/oz | $3,100/oz | Fed dovish pivot |
| Q2 | $3,100/oz | $3,500/oz | Dollar weakness (-11%) |
| Q3 | $3,500/oz | $4,000/oz | Central bank buying |
| Q4 | $4,000/oz | $4,553/oz | Year-end safe-haven rush |
Source: Forex.com
What Drove the Rally
According to NewsNation:
“Gold hit more than $4,500 per troy ounce on Friday—the commodity’s highest peak yet and more than double the nearly $2,100 price per troy ounce at the close of 2023.”
Key drivers identified:
-
Dollar Collapse: According to a Morgan Stanley report cited by ABC News, the US dollar plunged about 11% against other currencies in the first half of 2025—the biggest decline in more than 50 years.
-
Central Bank Buying: The World Gold Council reports central banks have continued accumulating gold for the tenth consecutive month, reinforcing structural demand.
-
Fed Rate Cuts: The Federal Reserve has cut rates three times in 2025, bringing the fed funds rate from 5.25-5.50% to 3.50-3.75%, according to CNBC.
Silver Steals the Show: +165% YTD
While gold’s performance has been exceptional, silver has been the star of 2025.
According to FinancialContent:
“Spot silver prices surged to an unprecedented intraday peak of $75.98 per ounce on December 26, capping off a ‘Santa Claus rally’ that has left market analysts and industrial consumers in a state of shock.”
Silver’s December Surge
| Date | Price | Milestone |
|---|---|---|
| Dec 1 | $52/oz | Month opens |
| Dec 9 | $60/oz | Historic high broken |
| Dec 11 | $64.21/oz | New all-time high |
| Dec 26 | $75.98/oz | Record intraday peak |
| Dec 28 | $77.20/oz | Current |
Source: Carbon Credits
Why Silver Is Outperforming Gold
According to Investing.com, three key factors are driving silver’s outperformance:
-
Industrial Demand Surge: Industrial demand hit a record 680.5 million ounces in 2024 and is expected to surpass 700 million ounces in 2025, according to the Silver Institute.
-
Solar Panel Growth: Solar photovoltaic applications account for over 30% of industrial demand. The shift to TOPCon solar cells has increased silver consumption per cell by 50%.
-
Supply Deficit: The Silver Institute forecasts a supply deficit of approximately 117 million ounces in 2025—one of the largest in recent years.
According to AInvest:
“COMEX inventory levels have plummeted by 70% since 2020, leading to what many traders are calling a ‘physical squeeze.’”
Gold/Silver Ratio: What It Tells Us
The gold/silver ratio has collapsed from 90 at the start of 2025 to just 59 today—a 34% decline that signals silver’s relative strength.
| Ratio Level | Historical Context | Current Status |
|---|---|---|
| Above 80 | Silver undervalued | Not applicable |
| 60-80 | Normal range | Just exited |
| Below 60 | Silver outperforming | Current: 59 |
| Below 50 | Silver mania | Watch for this |
Historical average: 65. Current ratio of 59 suggests continued silver strength.
Technical Outlook for Week Ahead
According to FX Leaders:
“Gold closed Friday near $4,533 after extending its rising channel. Holding above $4,470 keeps $4,600 and $4,645 in focus next week.”
Gold Technical Levels
| Level | Price | Significance |
|---|---|---|
| Support 1 | $4,470 | Must hold for bullish trend |
| Support 2 | $4,400 | Strong floor |
| Resistance 1 | $4,600 | Near-term target |
| Resistance 2 | $4,645 | Channel top |
Silver Technical Levels
| Level | Price | Significance |
|---|---|---|
| Support 1 | $72 | Recent breakout level |
| Support 2 | $65 | Strong psychological |
| Resistance 1 | $80 | Psychological barrier |
| Resistance 2 | $100 | 2026 target |
2026 Price Predictions
Analysts are increasingly bullish on precious metals heading into 2026.
Gold Forecasts
| Source | 2026 Target | Rationale |
|---|---|---|
| Analysts (consensus) | $5,000/oz | Fed easing, safe-haven demand |
| Daily Forex | $5,000 by Spring | Technical momentum |
| Bulls | $5,500/oz | Dollar crisis scenario |
Silver Forecasts
| Source | 2026 Target | Rationale |
|---|---|---|
| CBS News | $100/oz | Supply deficit, industrial demand |
| Silver Institute | $90-100/oz | Structural deficit |
| Conservative | $80-85/oz | Current momentum continues |
Fed Watch: January 2026 Meeting
According to Chase, the December FOMC meeting revealed significant disagreement about the path forward.
| Indicator | Current | Outlook |
|---|---|---|
| Fed Funds Rate | 3.50-3.75% | Hold expected Jan 2026 |
| January Rate Cut Probability | 24.4% | Per CME FedWatch |
| 2026 Dot Plot | 1 cut expected | But 7 officials want none |
According to CNN, the Fed’s December vote was contentious at 9-3, with dissents on both sides—some wanting no cut, others wanting a larger 50bps cut.
What This Means for Gold Investors
2025 Performance Summary
| If You Invested | In January | Worth Today | Gain |
|---|---|---|---|
| $10,000 in gold | $2,600/oz | $17,500 | +75% |
| $10,000 in silver | $29/oz | $26,600 | +166% |
| $10,000 in S&P 500 | 4,770 | $12,500 | +25% |
| $10,000 in savings | 5% APY | $10,500 | +5% |
Key Takeaways for Indian Investors
-
Gold in INR: At ₹78,000/10g (estimated based on current rates), gold has delivered exceptional returns for NRI investors despite rupee weakness.
-
Portfolio Rebalancing: With gold’s historic run, consider whether your allocation still matches your targets.
-
Silver Opportunity: The gold/silver ratio at 59 suggests silver still has room to run relative to gold.
-
Dollar Hedge: Gold’s 75% gain coincided with an 11% dollar decline—demonstrating gold’s role as a currency hedge.
The Week Ahead
| Event | Date | Potential Impact |
|---|---|---|
| Year-end positioning | Dec 30-31 | Possible profit-taking |
| 2026 opens | Jan 2 | New inflows expected |
| US jobs data | Jan 10 | Could influence Fed path |
| Fed meeting | Jan 28-29 | Rate decision |
According to MarketBeat, gold stocks like Freeport-McMoRan, Hecla Mining, and Newmont remain top picks as the sector continues to benefit from rising metal prices.
Start 2026 with Gold on Mantra Mint
2025 proved why gold belongs in every portfolio. Don’t miss the next leg higher.
2025 Results Speak:
- Gold: +75% — Outperformed every major asset class
- Silver: +165% — Historic outperformance
- Savings accounts: +5% — Barely beat inflation
Why Mantra Mint for 2026:
- Start with $10 — No minimums
- Real gold backing — Not paper promises
- Perfect for NRIs — USD-based, India-connected
- Gift option — Share the wealth with family
Gold at $4,500 may seem expensive—but so did $2,600 in January. Start building your position today.
Buy Gold Now — Don’t wait for $5,000.
Sources
- Bloomberg - Gold and Silver Smash Records
- Yahoo Finance - Gold Futures
- Yahoo Finance - Silver Futures
- ABC News - Why Gold and Silver Are Hitting Record Highs
- CNBC - Fed December Rate Decision
- Federal Reserve - FOMC Statement December 2025
- FX Leaders - Gold Price Forecast
- NewsNation - Gold Record Highs
- FinancialContent - Silver Shatters Records
- Carbon Credits - Silver Supply Deficit
- Investing.com - Silver Rally Analysis
- Chase - Fed Meeting December 2025 Recap
Ready to start investing in gold?
Join thousands of Indian families building wealth with Mantra Mint.
Get Started Free