Gold's Secular Bull Market: Why This Rally Could Last a Decade
With gold surging 63% in 2025 and breaking above $4,000 for the first time in history, a growing chorus of analysts argues we’re not witnessing a short-term rally—we’re in the early stages of a secular bull market that could last a decade.
According to Seeking Alpha:
“With gold breaking its previous all-time highs for three consecutive quarters, it has officially entered a secular bull market which suggests a steady rise in prices for the next several years.”
Let’s examine the historical evidence, the structural drivers, and what this means for investors positioning for the long term.
What Is a Secular Bull Market?
A secular bull market is a long-term trend lasting years or decades, characterized by structural factors driving sustained price appreciation. This is distinct from cyclical rallies that last months or quarters.
According to Discovery Alert:
“Gold is firmly anchored in a robust secular bull market, with incredibly resilient structural and fundamental factors sending the precious metal into even greater heights.”
| Market Type | Duration | Characteristics |
|---|---|---|
| Cyclical rally | Months to quarters | Short-term catalyst, often reverses |
| Secular bull market | 5-15 years | Structural drivers, multiple legs |
| Secular bear market | 10-20 years | Prolonged underperformance |
Historical Gold Bull Markets: A Pattern Emerges
The 1970s Bull Market (1971-1980)
According to Gainesville Coins, the 1970s gold bull market remains the most dramatic on record:
| Metric | 1970s Bull Market |
|---|---|
| Duration | ~9 years |
| Start Price | $35/oz (1971) |
| Peak Price | $850/oz (Jan 1980) |
| Total Return | +2,329% |
| Key Driver | Nixon ends gold standard, inflation |
According to US Money Reserve:
“When President Nixon severed the dollar’s convertibility to gold in August 1971, ending the Bretton Woods system, gold prices exploded from their fixed $35 per ounce level.”
Key Characteristics:
- Vietnam War spending drove inflation
- Oil crises amplified uncertainty
- Double-digit inflation (peaked at 14.8%)
- Iran hostage crisis added fuel in 1979-1980
- Five corrections exceeding 15% along the way
The 2001-2011 Bull Market
According to Discovery Alert:
| Metric | 2001-2011 Bull Market |
|---|---|
| Duration | ~10-12 years |
| Start Price | $250-255/oz (2001) |
| Peak Price | $1,900-1,921/oz (Sept 2011) |
| Total Return | +650-660% |
| Key Drivers | 9/11, Iraq War, financial crisis |
“This cycle lasted approximately 3,650 days—the longest in modern history—and delivered returns of roughly 650% from trough to peak.”
Key Characteristics:
- 9/11 attacks sparked initial safe-haven buying
- Iraq War maintained uncertainty
- Housing bubble recognition (2005-2007)
- Financial crisis (2008-2009) drove massive demand
- QE programs accelerated the final leg
The Current Bull Market (2018-Present)
According to VanEck:
| Metric | Current Bull Market |
|---|---|
| Duration (so far) | ~7 years |
| Start Price | ~$1,200/oz (2018) |
| Current Price | $4,355/oz |
| Return (so far) | +263% |
| Key Drivers | Central banks, de-dollarization, debt |
“Over the past decade, gold has transitioned from a cyclical safe haven to what many analysts now describe as a structural necessity in diversified portfolios.”
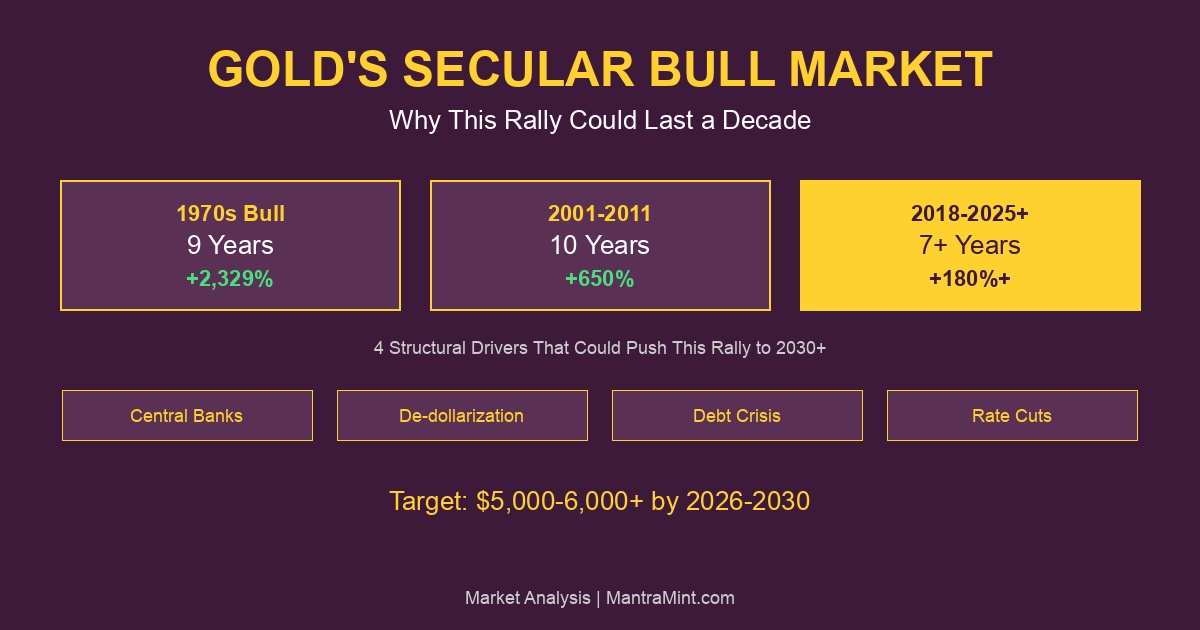
Comparing the Three Bull Markets
| Era | Duration | Return | Peak Driver |
|---|---|---|---|
| 1970s | 9 years | +2,329% | Inflation/currency crisis |
| 2001-2011 | 10-12 years | +650% | Financial crisis/QE |
| 2018-present | 7+ years | +263% | Central banks/de-dollar |
According to Discovery Alert:
“If the S&P 500 reaches its secular peak in 2025-2026, this pattern would suggest a potential precious metals peak in the early-to-mid 2030s.”
The 4 Structural Drivers Behind This Secular Bull
1. Central Bank Buying at Record Levels
According to J.P. Morgan:
“Since 2022, central banks have purchased over 1,000 tonnes of gold annually—roughly twice the decade-long average.”
| Central Bank Metric | Data | Source |
|---|---|---|
| Annual buying (2022-2025) | 1,000+ tonnes/year | J.P. Morgan |
| 2026 forecast | 585 tonnes/quarter | J.P. Morgan |
| Gold as % of reserves | ~20% (up from 15% in 2023) | VanEck |
| Total global holdings | 36,200 tonnes | VanEck |
According to State Street Global Advisors:
“Central bank demand is now a structural pillar of the gold market.”
2. De-Dollarization Accelerating
According to AInvest:
“Geopolitical tensions and de-dollarization accelerated gold adoption, with emerging markets diversifying reserves away from dollar assets for the first time in 30 years.”
| De-Dollarization Metric | Status |
|---|---|
| Dollar share of reserves | 56% (30-year low) |
| Gold surpassing Treasuries | First time since 1996 |
| BRICS gold reserves | 6,000+ tonnes |
| BRICS Unit (pilot) | 40% gold-backed |
3. Debt Crisis Driving “Debasement Trade”
According to Investing.com:
“Global sectoral debt rose to $340T in mid-2025 and, notably, the government share of that debt also reached a record 30%. At 3-4x global GDP, debt levels raise concern for investors.”
| Debt Metric | Current | Source |
|---|---|---|
| Global debt | $340 trillion | Investing.com |
| US debt-to-GDP | ~125% | Government data |
| Fiscal deficits | $1.8+ trillion annually | US Treasury |
According to Medium:
“The 2025–2026 metals surge is characterized by the convergence of multiple structural forces that have never aligned simultaneously.”
4. Federal Reserve Rate Cuts
According to J.P. Morgan:
“Markets now price at least two additional Federal Reserve cuts in 2026, which would push the policy rate back toward the low-3% region and suppress real yields further.”
| Fed Policy Factor | Impact on Gold |
|---|---|
| 2025 cuts (175 bps) | Major tailwind |
| 2026 expected cuts | Additional support |
| Real yields declining | Bullish |
| Dollar weakness | Bullish |
Analyst Price Targets: 2026-2030
2026 Forecasts
According to J.P. Morgan:
| Institution | 2026 Target | Source |
|---|---|---|
| J.P. Morgan | $5,000-5,055/oz (Q4) | J.P. Morgan |
| Goldman Sachs | $4,900/oz (Dec) | Finance Magnates |
| Morgan Stanley | $4,500/oz (mid-year) | Morgan Stanley |
| Long Forecast | $6,376/oz (optimistic) | Long Forecast |
2027-2028 Forecasts
According to LiteFinance:
| Year | Projection | Source |
|---|---|---|
| 2027 | $5,400/oz (J.P. Morgan) | J.P. Morgan |
| 2027 | $8,381/oz (Long Forecast, optimistic) | Long Forecast |
| 2028 | $9,658/oz (Long Forecast, optimistic) | Long Forecast |
2030 Forecasts
According to InvestingHaven:
| Source | 2030 Target |
|---|---|
| InvestingHaven | $6,200/oz |
| VanEck | $5,000/oz |
| StoneX Bullion | $4,500-5,150/oz |
| Historical extrapolation | $7,000-8,000/oz |
“Historical analysis of breakouts projects potential targets of $7,000-$8,000 per ounce by 2027-2028.”
How Long Could This Bull Market Last?
According to Discovery Alert:
“Historical analysis suggests if the stock market reaches a secular peak around 2026-2027, historical parallels suggest the precious metals bull market could extend until at least 2035.”
| Historical Pattern | Implication |
|---|---|
| 1970s lasted 9 years | Current at 7 years |
| 2001-2011 lasted 10-12 years | Room for 3-5 more years |
| S&P secular peaks correlate | Mid-2030s precious metals peak possible |
Bull Market Phase Analysis
According to Discovery Alert:
| Phase | Characteristics | Current Status |
|---|---|---|
| Early (Years 1-3) | Skepticism, gradual accumulation | Passed |
| Middle (Years 4-7) | Growing recognition, institutional buying | Current |
| Late (Years 8-12) | Mania, public participation, peak | Ahead |
Based on historical patterns, we appear to be in the middle phase of this secular bull market—past the initial skepticism but before the mania phase that typically marks cycle peaks.
Corrections Are Normal Within Secular Bulls
According to Bullion Trading LLC:
“The 1970s gold bull market featured five corrections exceeding 15%, yet ultimately delivered 2,329% returns.”
| Bull Market | Notable Corrections |
|---|---|
| 1970s | -47% (1974), -25% (1976) |
| 2001-2011 | -34% (2008), -15-20% every 18-24 months |
| Current (2025) | Various 5-10% pullbacks |
According to Morningstar:
“Throughout the 2001-2011 period, gold experienced corrections of 15-20% roughly once every 18-24 months.”
Expect similar volatility in the current bull market—pullbacks of 10-20% are healthy and provide accumulation opportunities.
What Makes This Bull Market Different
Unprecedented Convergence
According to Medium:
“The 2025–2026 metals surge is characterized by the convergence of multiple structural forces that have never aligned simultaneously: coordinated central bank buying on a massive scale, persistent industrial supply deficits, accelerating de-dollarization efforts by emerging economies, expectations of Federal Reserve rate cuts, and explosive industrial demand from green technologies.”
| Factor | 1970s | 2001-2011 | 2025+ |
|---|---|---|---|
| Central bank buying | Selling | Mixed | Record buying |
| De-dollarization | Limited | Emerging | Accelerating |
| Debt levels | High | Very high | Unprecedented |
| ETF access | None | Growing | Massive |
| EM demand | Limited | Growing | Structural |
Institutional Validation
According to VanEck:
“Gold has transitioned from a cyclical safe haven to what many analysts now describe as a structural necessity in diversified portfolios.”
This represents a fundamental shift in how institutions view gold—not as a trading vehicle but as a permanent portfolio allocation.
For Indian Investors: Long-Term Implications
Cultural Alignment
The secular bull market aligns perfectly with Indian traditions of long-term gold accumulation:
| Factor | Advantage |
|---|---|
| Wedding planning | 3-5 year accumulation period matches |
| Generational wealth | 10+ year horizon ideal |
| Rupee depreciation | Amplifies USD gold returns |
| Import duty cut | 15% → 6% improves access |
Wealth Compounding
| Investment | Decade Return (Historical) | If Repeated |
|---|---|---|
| 1970s gold | 2,329% | $10,000 → $242,900 |
| 2001-2011 gold | 650% | $10,000 → $75,000 |
| Current (projected) | 300-500%+ | $10,000 → $40,000-60,000 |
How to Position for a Decade-Long Bull
Allocation Framework
| Investor Type | Gold Allocation | Strategy |
|---|---|---|
| Conservative | 10-15% | Buy and hold, rebalance |
| Moderate | 15-20% | DCA monthly, add on dips |
| Aggressive | 20-30% | Full allocation, tactical adds |
Accumulation Strategies
| Strategy | Description | Best For |
|---|---|---|
| Lump sum | Full allocation now | High conviction |
| DCA monthly | Fixed amount each month | Most investors |
| Buy the dip | Add on 10%+ pullbacks | Active investors |
| Hybrid | 50% now, 50% over time | Balanced approach |
Key Levels to Watch
| Level | Significance |
|---|---|
| $4,000 | Major psychological support |
| $4,500 | Breakout confirmation |
| $5,000 | J.P. Morgan 2026 target |
| $6,000 | Long-term target |
The Bottom Line
Gold has entered a secular bull market—a multi-year structural trend driven by forces that aren’t going away. Central bank buying, de-dollarization, debt concerns, and monetary policy all point to sustained demand.
According to J.P. Morgan:
“Prices are expected to push toward $5,000/oz by the fourth quarter of 2026, with $6,000/oz a possibility longer term.”
Key takeaways:
- Historical bull markets lasted 9-12 years; current is at 7 years
- 1970s delivered 2,329% returns, 2001-2011 delivered 650%
- Four structural drivers remain firmly in place
- Analyst targets: $5,000+ by 2026, $6,000+ possible by 2030
- Corrections of 10-20% are normal—use them to accumulate
The question isn’t whether to own gold—it’s whether you’re positioned for a decade-long rally.
Position for the Decade with Mantra Mint
Secular bull markets reward patient accumulators. Start building your position now.
Why Mantra Mint:
- Start with $10 — No minimum investment
- Auto-invest weekly — Dollar-cost average automatically
- Real gold backing — Not paper promises
- Perfect for NRIs — Bridge USA and India seamlessly
The Secular Case:
- Historical bulls: 9-12 years, 650-2,329% returns
- Current bull: 7 years in, 263% so far
- Analyst targets: $5,000-6,000+ by 2026-2030
- Structural drivers intact for years ahead
Don’t time the market. Time in the market.
Start Your Gold Position — Build for the decade.
Sources
- Seeking Alpha - Gold’s Secular Bull Market Turns More Convincing
- Discovery Alert - Secular Bull Market Precious Metals 2025
- VanEck - Gold in 2025: A New Era of Structural Strength
- J.P. Morgan - Gold Price Predictions
- Gainesville Coins - 50-Year Gold Price History
- Discovery Alert - Gold Bull Market Duration Patterns
- US Money Reserve - Largest Gold Bull Runs
- State Street Global Advisors - Gold 2026 Outlook
- Investing.com - Gold Structural Bull Run
- Medium - Precious Metals Supercycle 2025-2026
- InvestingHaven - Gold Price Prediction 2025-2030
- LiteFinance - Gold Price Forecast 2025-2030
- Long Forecast - Gold Price Forecast 2025-2028
- AInvest - Gold Structural Bull Case 2025
Ready to start investing in gold?
Join thousands of Indian families building wealth with Mantra Mint.
Get Started Free