Gold Mining Stocks vs Physical Gold: Which Investment Won in 2025?
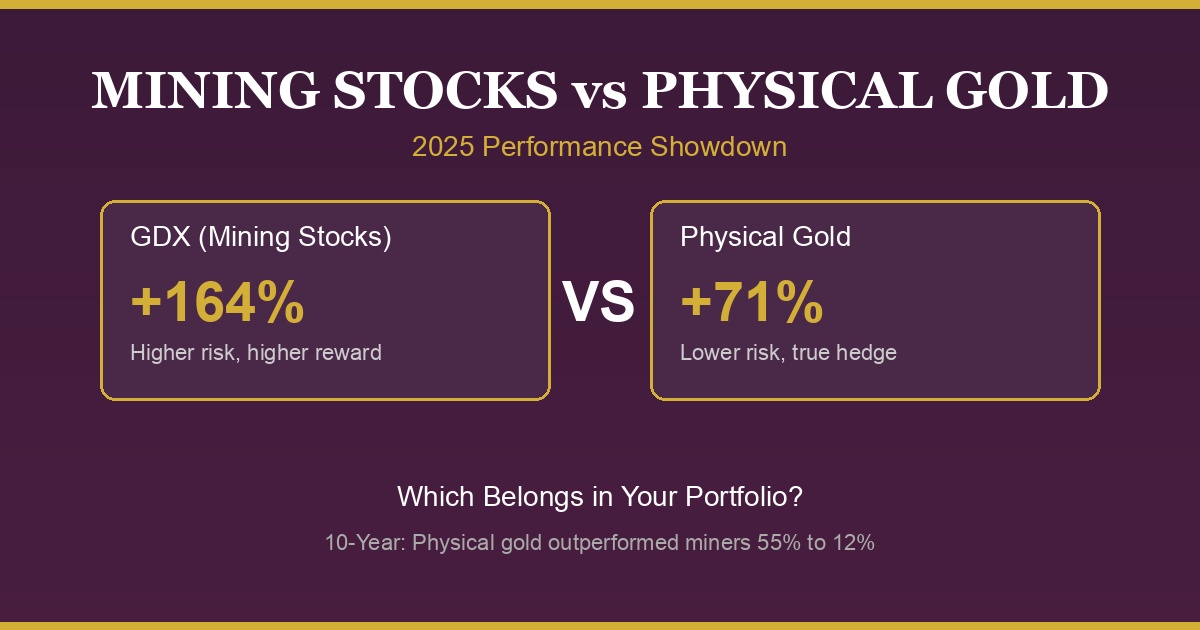
In 2025, the choice between gold mining stocks and physical gold became more consequential than ever. While physical gold delivered its best performance since 1979 with a 71% gain, gold mining stocks more than doubled those returns. According to VanEck, the Gold Miners ETF (GDX) returned an astonishing 164% for the year.
But here’s what makes this comparison fascinating: over the past decade, physical gold actually outperformed mining stocks significantly. Understanding when each asset shines—and when it stumbles—is essential for building a smart precious metals strategy.
Current Market Snapshot
| Metric | Current | 2025 Return | Source |
|---|---|---|---|
| Gold Spot Price | $4,561/oz | +71% YTD | Yahoo Finance |
| Silver Spot Price | $77.47/oz | +158% YTD | Yahoo Finance |
| Gold-Silver Ratio | 58.9:1 | Compressed | Calculated |
| GDX (Gold Miners ETF) | $91.43 | +164% YTD | VanEck |
| Newmont (NEM) | $105.89 | +160% YTD | Yahoo Finance |
| Barrick Gold (GOLD) | — | +181% YTD | Financial Content |
Gold Prices in India Today
| Metric | Price (₹) | Change | Source |
|---|---|---|---|
| 24K Gold (10g) | ₹1,40,020 | +₹770 | GoodReturns |
| 22K Gold (10g) | ₹1,28,350 | +₹700 | Market data |
| 18K Gold (10g) | ₹1,05,020 | +₹580 | Market data |
The 2025 Divergence: Why Miners Crushed Physical Gold
According to ETF.com, the performance of gold mining stocks has doubled that of spot gold in 2025. Here’s why:
The Leverage Effect Explained
| Scenario | Gold Price | Miner Cost | Profit/oz | Profit Change |
|---|---|---|---|---|
| Starting point | $2,650/oz | $1,500/oz | $1,150/oz | — |
| After 71% rally | $4,550/oz | $1,630/oz | $2,920/oz | +154% |
According to APMEX:
“Leverage means that a small change in the gold price can lead to a much larger change in a mining company’s profits. If a miner’s cost to produce an ounce of gold is $1,500 and the gold price rises from $1,800 to $2,100 (a 16.7% increase), the miner’s profit per ounce doubles from $300 to $600 (a 100% increase).”
This is exactly what happened in 2025—with gold rising 71%, mining profits roughly tripled.
Top Performer: Newmont Corporation
According to Financial Content:
| Metric | Value | Context |
|---|---|---|
| Stock return | +160% | World’s largest gold miner |
| AISC (costs) | ~$1,630/oz | Well below $4,500 spot |
| Free cash flow | $4.5 billion | First 3 quarters of 2025 |
| Profit spread | ~$2,870/oz | Historic margin |
Barrick Gold’s Stunning Year
| Metric | Value | Impact |
|---|---|---|
| 2025 return | +181% | Top performer among majors |
| Strategic focus | Nevada & Africa | High-grade assets |
| Debt reduction | Aggressive | Windfall profits |
| Dividend hikes | Significant | Shareholder returns |
The Historical Reality Check: Long-Term Comparison
Before declaring mining stocks the winner, consider the longer-term picture. According to IncomeShares:
10-Year Performance (2013-2023)
| Asset | Return | CAGR | Volatility |
|---|---|---|---|
| Physical Gold | +55% | 4.5% | Lower |
| GDX (Miners) | +12% | 1.1% | Higher |
| Underperformance | -43% | — | — |
“Over the past decade, physical gold has outperformed most mining stocks and indexes. From 2013 to 2023, gold prices rose roughly 55%, while the GDX ETF gained just over 12%, weighed down by company-specific headwinds.”
10-Year Performance (2015-2025)
| Asset | Total Return | CAGR | Source |
|---|---|---|---|
| GDX | +169% | 10.4% | VanEck |
| Physical Gold | ~+140% | ~9.1% | Market data |
The 2025 surge dramatically improved mining stocks’ long-term numbers.
Understanding the Volatility Gap
According to Morningstar:
Risk Metrics Comparison
| Metric | GLD (Physical) | GDX (Miners) | Interpretation |
|---|---|---|---|
| 1-Year Std Dev | 14.2% | 34.34% | Miners 2.4x more volatile |
| Beta | 0.3 | 0.9 | Miners more correlated to market |
| Max drawdown (2008) | -3% | -25%+ | Miners crash harder |
“Over the past year, GDX exhibited a standard deviation of 34.34%, compared to GLD’s 14.2%. This indicates that GDX’s returns fluctuated more than twice as much as those of GLD.”
Physical Gold: The Case For
According to BullionByPost and Tavex Bullion:
Advantages of Physical Gold
| Advantage | Explanation |
|---|---|
| Tangible ownership | You own the metal, not paper claims |
| Zero counterparty risk | No company can fail and take your gold |
| Lower volatility | More stable returns over time |
| True crisis hedge | Performs when everything else fails |
| 5,000-year track record | Proven store of value |
| Portfolio diversification | Reduces overall portfolio risk |
When Physical Gold Wins
| Scenario | Gold Performance | Miners Performance |
|---|---|---|
| 2008 Financial Crisis | -3% | -25%+ |
| 2013-2023 Decade | +55% | +12% |
| Market panics | Safe haven flows | Sold with equities |
| Sideways gold markets | Holds value | Suffers from costs |
According to GoldAvenue:
“Gold bullion has appreciated more in price than gold miners over the past 40 years, with much lower volatility.”
Gold Mining Stocks: The Case For
Advantages of Mining Stocks
| Advantage | Explanation |
|---|---|
| Leverage to gold price | 2-3x returns in bull markets |
| Dividend income | Miners pay dividends; gold doesn’t |
| Liquidity | Easy to trade on exchanges |
| Tax treatment | Long-term capital gains rates |
| Operational improvements | Companies can cut costs |
| Discovery upside | New deposits add value |
When Miners Win
| Scenario | Gold Performance | Miners Performance |
|---|---|---|
| 2025 bull market | +71% | +164% |
| Gold price spikes | Good | Excellent |
| Low interest rates | Good | Better |
| Strong economy + gold rally | Modest | Outstanding |
According to The Motley Fool:
“Gold mining stocks have emerged as one of the top-performing asset classes in 2025, driven by a combination of surging gold prices, improved profitability, and shifting investor sentiment.”
The Hidden Risks of Mining Stocks
According to StoneX Bullion and Money.com:
Operational and Business Risks
| Risk Type | Examples | Impact on Stock |
|---|---|---|
| Operational | Mine collapses, equipment failures | Can be catastrophic |
| Political | Nationalization, regulation | Asset seizure risk |
| Management | Poor hedging, bad acquisitions | Value destruction |
| Cost inflation | Energy, labor increases | Margin compression |
| Environmental | Cleanup liabilities, ESG concerns | Unexpected costs |
| Exploration | Dry holes, reserve downgrades | Write-offs |
“Mining stocks carry risks that physical gold does not, including operational risks, political risks, management risks, and rising input costs. These factors can eat into a mining company’s profitability, even when the price of gold is rising.”
Market Correlation Risk
| Scenario | Physical Gold | Mining Stocks |
|---|---|---|
| 2008 panic | Safe haven | Sold with everything |
| COVID crash (Mar 2020) | Initial dip, quick recovery | Crashed with market |
| General market selloff | Often rises | Falls with equities |
“One of the most overlooked downsides of gold stocks is their correlation to the broader equity market. When panic hits, gold mining stocks often get lumped in with the rest.”
GDX Holdings: What You’re Actually Buying
According to VanEck:
Top 10 Holdings in GDX
| Company | Weight | Type |
|---|---|---|
| Agnico Eagle Mines | 9.06% | Senior producer |
| Newmont | 8.77% | Largest miner |
| Barrick Gold | 7.18% | Senior producer |
| Wheaton Precious Metals | 6.52% | Streaming |
| Gold Fields | 5.87% | International |
| Franco-Nevada | 5.15% | Royalty |
| Kinross Gold | 4.89% | Mid-tier |
| Northern Star Resources | 4.71% | Australian |
| Zijin Mining Group | 4.23% | Chinese |
| AngloGold Ashanti | 3.98% | South African |
Total Assets: $26.92 billion Expense Ratio: 0.51%
Expert Perspectives: How to Choose
According to Morningstar’s Bragazza:
“Physical gold exposure is preferable to get an outcome more closely aligned with gold prices, whilst more risk or income seeking investors may be more interested in leveraging up their gold exposure by buying gold miners.”
“An investor interested in bringing the diversifying characteristics of gold into portfolios is more likely to prefer exposure to physical gold, rather than mining companies.”
The Professional Allocation Approach
| Investor Goal | Recommended | Rationale |
|---|---|---|
| Wealth preservation | Physical gold | Lower volatility, true hedge |
| Portfolio diversification | Physical gold | Better risk reduction |
| Income generation | Mining stocks | Dividends available |
| Aggressive growth | Mining stocks | Leverage to gold price |
| Crisis protection | Physical gold | Performs when markets panic |
| Bull market speculation | Mining stocks | Amplified returns |
The Tax Consideration
| Investment Type | Tax Treatment | Rate |
|---|---|---|
| Physical gold (collectibles) | Short-term: ordinary income; Long-term: max 28% | Higher |
| Gold mining stocks | Long-term capital gains | 0%, 15%, or 20% |
| Gold ETFs (GLD, IAU) | Treated as collectibles | Max 28% |
| Mining ETFs (GDX) | Long-term capital gains | 0%, 15%, or 20% |
This tax difference can significantly impact after-tax returns, especially for high-income investors.
For Indian Investors: Special Considerations
NRI Investment Options
| Option | Accessibility | Best For |
|---|---|---|
| Physical gold (India) | Medium | Long-term family wealth |
| Digital gold (Mantra Mint) | High | Convenience, gifting |
| US gold ETFs (GLD, IAU) | High | USD exposure |
| Mining ETFs (GDX) | High | Aggressive allocation |
| Sovereign Gold Bonds | Low (NRI restrictions) | Tax-free returns |
Cultural vs Financial Considerations
| Factor | Physical Gold | Mining Stocks |
|---|---|---|
| Gifting traditions | ✓ Perfect | ✗ Not suitable |
| Wedding gold | ✓ Essential | ✗ Can’t gift stocks |
| Streedhan | ✓ Traditional | ✗ Not recognized |
| Festival purchases | ✓ Auspicious | ✗ No cultural significance |
| Portfolio allocation | ✓ Good for 5-10% | ✓ Good for 2-5% |
For Indian families, physical gold serves purposes that mining stocks simply cannot fulfill.
Recommended Allocation Framework
Based on the research and expert opinions:
Conservative Investor
| Asset | Allocation | Purpose |
|---|---|---|
| Physical/Digital Gold | 10-15% | Core hedge |
| Gold Mining Stocks | 0-2% | Optional |
| Total Precious Metals | 10-17% | — |
Moderate Investor
| Asset | Allocation | Purpose |
|---|---|---|
| Physical/Digital Gold | 8-12% | Primary gold exposure |
| Gold Mining Stocks | 2-4% | Tactical leverage |
| Total Precious Metals | 10-16% | — |
Aggressive Investor
| Asset | Allocation | Purpose |
|---|---|---|
| Physical/Digital Gold | 5-8% | Base allocation |
| Gold Mining Stocks | 5-8% | Growth component |
| Total Precious Metals | 10-16% | — |
The Bottom Line: Different Tools for Different Jobs
The 2025 data is clear:
- GDX: +164% YTD (more than double gold’s return)
- Physical Gold: +71% YTD (best year since 1979)
- Historical context: Physical gold outperformed miners over the past decade
But performance is only part of the story:
- Physical gold is for wealth preservation, crisis protection, and cultural traditions
- Mining stocks are for leveraged exposure during gold bull markets
- Most investors should hold primarily physical gold with optional mining exposure
- Indian investors have unique cultural reasons to prefer physical gold
According to the experts:
“Physical bullion should be a significant part of the strategic long-term allocation within a portfolio, whereas mining stocks should be a small part of a tactical equity component during certain conditions.”
Whether you’re building wealth for a wedding, creating a family legacy, or simply protecting your portfolio, understanding these differences helps you make smarter decisions with your precious metals allocation.
Start Your Gold Journey with Mantra Mint
Whether you prefer the stability of physical gold or want to participate in gold’s historic rally, Mantra Mint makes gold ownership simple for Indians in the USA.
Why Physical/Digital Gold Makes Sense:
- Stability: Lower volatility than mining stocks
- Flexibility: Gift, save, or invest on your terms
- Cultural relevance: Perfect for weddings, festivals, gifting
- No stock market correlation: True portfolio diversification
Why Mantra Mint?
- Start with $10: No minimum barriers
- 24K pure gold: Real gold, not paper claims
- Instant gifting: Send gold to family instantly
- Auto-invest: Dollar-cost average into gold
Start Building Your Gold Position — The stability you need, the flexibility you want.
Sources
- VanEck - Gold Miners ETF (GDX) Holdings & Performance
- ETF.com - GDX vs GLD: How Miners Are Doubling Gold’s Price
- APMEX - Gold Mining Stocks vs Physical Gold
- Morningstar - Should I Invest in Mining Stocks or Buy Physical Gold?
- Financial Content - Gold’s Historic 2025
- IncomeShares - Gold vs Gold Miners 10-Year Performance
- BullionByPost - Gold Mining Stocks or Physical Gold
- Tavex Bullion - Mining Stocks vs Physical Gold
- GoldAvenue - Gold or Gold Mining Stocks
- The Motley Fool - Precious Metals ETF Analysis
- Yahoo Finance - GDX
- Yahoo Finance - Gold Futures
- GoodReturns - India Gold Rates
- Money.com - Physical Gold vs Gold Stocks vs Gold ETFs
- StoneX Bullion - Mining Stocks vs Physical Gold
Ready to start investing in gold?
Join thousands of Indian families building wealth with Mantra Mint.
Get Started Free