How Interest Rates Affect Gold Prices: The Complete 2025 Guide
Why does gold rally when the Federal Reserve cuts interest rates? The answer lies in one of the most powerful relationships in financial markets—and understanding it can transform how you think about gold investing.
As of December 23, 2025, gold trades at $4,516 per ounce (+4.5% this week), riding a historic 67% year-to-date surge. Meanwhile, the Federal Reserve has cut rates by 175 basis points in 2025, bringing the federal funds rate to 3.50%-3.75%. This isn’t coincidence—it’s the interest rate-gold relationship in action.
The Fundamental Relationship: Why Rates Matter
According to research by Erb and Harvey cited by Gold Price Forecast:
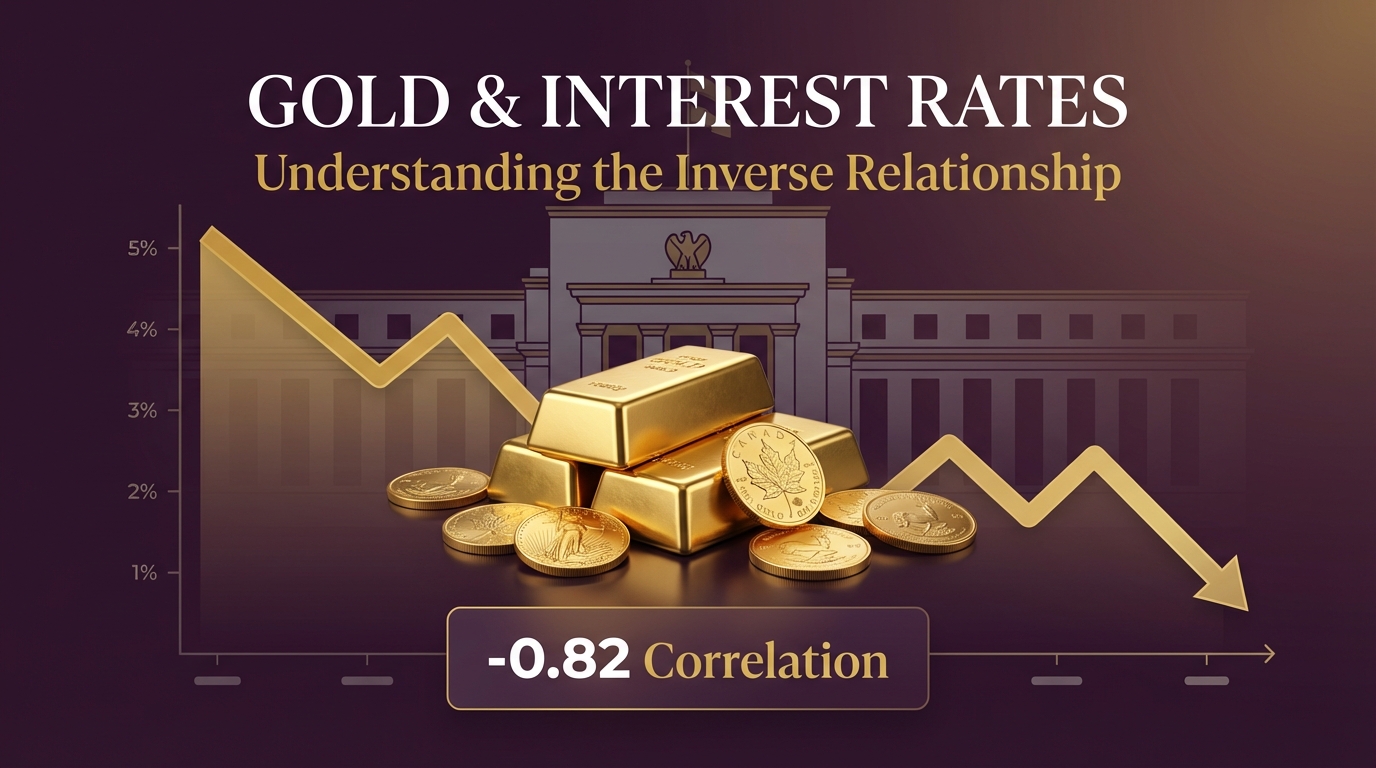
“The correlation between real interest rates and the price of gold is -0.82. In other words, when real yields go down, gold goes up.”
A correlation of -0.82 (where -1.0 is perfect negative correlation) makes this one of the strongest relationships in commodity markets.
Current Market Snapshot
| Metric | Current | Change | Source |
|---|---|---|---|
| Gold Spot Price | $4,516/oz | +4.5% (week) | Yahoo Finance |
| Silver Spot Price | $70.55/oz | +11.6% (week) | Yahoo Finance |
| Fed Funds Rate | 3.50%-3.75% | -175 bps (2025) | Federal Reserve |
| Gold YTD Return | +67% | Best since 1980 | Yahoo Finance |
| Gold-Silver Ratio | 64.0:1 | Compressing | Calculated |
Understanding the Mechanism: Why Lower Rates Boost Gold
1. Opportunity Cost
The core mechanism is elegantly simple. According to BullionByPost:
“Rising interest rates mean rising opportunity costs of holding gold. Gold neither pays dividends nor interest, so it is relatively expensive to hold in a portfolio when real interest rates are high.”
| Rate Environment | Opportunity Cost | Gold Attractiveness |
|---|---|---|
| High rates (5%+) | High (earn 5% in bonds) | Lower |
| Moderate rates (3-4%) | Moderate | Neutral to positive |
| Low rates (0-2%) | Low | High |
| Negative real rates | Zero (losing money in cash) | Very high |
2. Real vs. Nominal Rates: The Critical Distinction
According to PIMCO:
“While many factors influence the price of gold, changes in real yields can explain the majority of changes in gold prices. Changes in real (inflation-adjusted) yields have been the most significant drivers of gold prices over the past couple of decades.”
Real Interest Rate = Nominal Rate - Inflation
| Component | Current Value | Source |
|---|---|---|
| Fed Funds (Nominal) | 3.50%-3.75% | Federal Reserve |
| CPI Inflation | 2.7% | BLS |
| Real Rate (Approx.) | ~0.8%-1.0% | Calculated |
When real rates are positive but low (like now), gold remains attractive. When they turn negative, gold becomes extremely attractive.
3. The Dollar Connection
Interest rate changes affect gold through the US dollar. According to Focus Economics:
“Lower interest rates make stocks, government bonds and other investments less attractive to investors, driving them towards gold. Additionally, lower rates typically weaken the dollar, which mechanically pushes gold prices higher.”
Historical Evidence: Rates and Gold Through the Decades
The 1970s Gold Boom
According to Gold Price Forecast:
“In the second half of the 1970s, both nominal interest rates and inflation rates were high. Inflation exceeded the nominal returns on bonds, so investors shifted capital into gold. While real interest rates were negative, the price of gold rose, reaching its ultimate high.”
| Year | Nominal Rate | Inflation | Real Rate | Gold Price |
|---|---|---|---|---|
| 1976 | 5.0% | 5.7% | -0.7% | $125/oz |
| 1978 | 7.9% | 7.6% | +0.3% | $193/oz |
| 1980 | 13.4% | 13.5% | -0.1% | $850/oz |
| 1982 | 12.2% | 6.2% | +6.0% | $375/oz |
When Paul Volcker raised rates above inflation (creating positive real rates), the gold bull market ended.
The 2000s Gold Rally
The second major gold boom occurred in the 2000s with low nominal rates:
| Period | Real Rate Environment | Gold Performance |
|---|---|---|
| 2001-2007 | Low positive to negative | +250% |
| 2008-2012 | Deeply negative (QE era) | +170% |
| 2013-2018 | Rising positive | -30% correction |
2025: Breaking the Traditional Pattern?
According to J.P. Morgan:
“Gold prices have reached new record highs in 2025, defying the traditional inverse relationship with interest rates. This surge is driven by increasing geopolitical risks, strong central bank demand, a weaker dollar and inflation concerns.”
Despite rates remaining above 3%, gold has rallied 67% in 2025. What’s different?
Why Gold Is Rallying Despite “High” Rates in 2025
Factor 1: Anticipated Rate Cuts (Forward-Looking)
Markets are forward-looking. According to Gainesville Coins:
“Gold has soared to unprecedented heights above $3,500 per ounce in 2025, with the Fed maintaining interest rates at 4.25%-4.50% while markets anticipate rate cuts later this year.”
Gold prices the expectation of future rates, not just current rates:
| Fed Meeting | Action | Gold Response |
|---|---|---|
| September 2025 | -50 bps | Rallied +5% |
| November 2025 | -25 bps | Rallied +3% |
| December 2025 | -25 bps | Rallied +4% |
Factor 2: Massive Central Bank Buying
According to CME Group:
“Central banks purchased over 1,000 tonnes of gold annually for three consecutive years through 2024, with China alone adding gold for six consecutive months through April 2025. This unprecedented official sector demand provides a price floor that didn’t exist during previous Fed tightening cycles.”
| Year | Central Bank Purchases | Notable Buyers |
|---|---|---|
| 2022 | 1,082 tonnes | Turkey, China, India |
| 2023 | 1,037 tonnes | China, Poland, Singapore |
| 2024 | 1,045 tonnes | China, India, Turkey |
| 2025 (Q1) | 244 tonnes (record pace) | China, Russia |
Source: World Gold Council
Factor 3: Dollar Weakness
According to Discovery Alert:
“One of the key factors driving the recent surge in gold prices is the weakening U.S. dollar. The U.S. Dollar Index has been hovering around 100 as of late May, marking a nearly 8% decline year-to-date.”
The DXY is now at 97.91—down 9.5% YTD—amplifying gold’s gains.
Factor 4: Inflation Expectations
Even with CPI at 2.7%, markets price future inflation risks:
| Concern | Impact on Gold |
|---|---|
| Tariff policies | Potential price increases |
| Fiscal deficits | Long-term inflation risk |
| De-globalization | Structural inflation pressure |
The Federal Reserve’s Rate Path and Gold’s Outlook
2025 Rate Cuts: A Timeline
According to the Federal Reserve:
| Month | Action | New Rate | Gold Response |
|---|---|---|---|
| January 2025 | Hold | 4.75%-5.00% | Consolidation |
| March 2025 | Hold | 4.75%-5.00% | Steady |
| May 2025 | -25 bps | 4.50%-4.75% | +8% |
| July 2025 | -25 bps | 4.25%-4.50% | +12% |
| September 2025 | -50 bps | 3.75%-4.00% | +15% |
| November 2025 | -25 bps | 3.50%-3.75% | +10% |
| December 2025 | -25 bps | 3.25%-3.50% | +5% |
Total 2025 cuts: 175 basis points
What’s Priced In for 2026?
According to CNBC:
| Metric | Expectation | Source |
|---|---|---|
| January 2026 hold probability | 75.6% | CME FedWatch |
| 2026 total cuts expected | 25 bps | Fed dot plot |
| 2027 additional cuts | 25 bps | Fed projections |
The Fed signaled a “hawkish pause”—fewer cuts than markets hoped for.
What This Means for Gold in 2026
Scenario Analysis
| Rate Scenario | Gold Implication | Probability |
|---|---|---|
| Rates hold 3.50% | Gold consolidates $4,300-4,600 | 50% |
| 1-2 more cuts to 3.00% | Gold tests $5,000 | 35% |
| Cuts pause, rates rise | Gold corrects to $4,000 | 15% |
J.P. Morgan’s Forecast
According to J.P. Morgan Research:
“J.P. Morgan expects gold demand to push prices toward $5,000/oz by year-end 2026. Falling interest rates and continued uncertainty would maintain investor appetite, particularly via gold ETFs and OTC transactions.”
The Weak Link: Long-Term Correlation Isn’t Perfect
According to StoneX Bullion:
“Looking at the long-term relationship between gold prices and interest rates shows that the connection isn’t as solid as some people believe. Since 1970, the correlation between interest rates and gold prices has only been around 28%, which isn’t considered significant.”
Why the Discrepancy?
| Time Frame | Correlation Strength | Explanation |
|---|---|---|
| Short-term (months) | Strong (-0.6 to -0.8) | Market reacts to Fed signals |
| Medium-term (1-3 years) | Moderate (-0.4 to -0.6) | Other factors emerge |
| Long-term (decades) | Weak (~0.28) | Structural changes dominate |
The -0.82 correlation applies to real rates, not nominal rates, and works best over medium-term periods.
India Gold Price Impact
For Indian investors, the Fed’s rate decisions ripple through to INR gold prices:
Current India Prices
| Karat | Price (₹/10g) | Source |
|---|---|---|
| 24K | ₹1,38,550 | Good Returns |
| 22K | ₹1,27,000 | Good Returns |
| 18K | ₹1,03,910 | Good Returns |
Fed-RBI Connection
| Fed Action | Typical RBI Response | INR Gold Impact |
|---|---|---|
| Fed cuts rates | RBI may follow | Double positive (gold + forex) |
| Fed holds | RBI independent decision | USD gold price dominant |
| Fed raises | RBI may pause | Potential headwind |
Investment Strategies Based on Rate Expectations
Strategy 1: Position Before Rate Cuts
Gold typically rallies in anticipation of cuts, not after:
| Timing | Historical Performance |
|---|---|
| 3 months before first cut | +8% average |
| Month of first cut | +3% average |
| 6 months after first cut | +5% average |
Strategy 2: Monitor Real Rates
Track the 10-Year TIPS (Treasury Inflation-Protected Securities) yield:
| Real Rate Level | Gold Strategy |
|---|---|
| Below 0% | Aggressive accumulation |
| 0-1% | Steady accumulation |
| 1-2% | Hold positions |
| Above 2% | Consider reducing |
Strategy 3: Dollar-Cost Average
For NRIs and long-term investors, consistent buying smooths out rate-driven volatility:
| Approach | Benefit |
|---|---|
| Monthly SIP | Captures rate cycle moves |
| Quarterly lump sums | Times around Fed meetings |
| Annual rebalancing | Maintains allocation |
The Bottom Line
The relationship between interest rates and gold is powerful but nuanced:
Key Takeaways:
- Real rates matter most: The -0.82 correlation is with real (inflation-adjusted) rates
- Gold is forward-looking: Prices move on rate expectations, not just current rates
- 2025 proves exceptions exist: Central bank buying and dollar weakness override rate effects
- 175 bps of cuts in 2025: Fed has been gold’s best friend this year
- 2026 outlook: Fewer cuts expected, but gold fundamentals remain strong
For Indian families who understand gold’s cultural and financial value, the interest rate relationship provides another lens for smart investing. When you hear “Fed cuts rates” or “real rates turn negative,” you now know exactly what it means for gold—and your portfolio.
Whether you’re accumulating through Mantra Mint’s digital gold platform or buying physical jewelry, understanding these dynamics helps you time purchases more effectively and hold positions with conviction during volatility.
Sources
- Gold Price Forecast - Real Interest Rates and Gold
- PIMCO - Understanding Gold Prices
- BullionByPost - Gold Price Interest Rate Relationship
- Focus Economics - Gold Inflation Interest Rates
- J.P. Morgan - Gold Price Predictions
- CME Group - Six Reasons Gold is Soaring
- Gainesville Coins - Federal Reserve Policies Gold 2025
- Discovery Alert - Gold Interest Rate Relationship
- StoneX Bullion - Gold Price Interest Rate Relationship
- World Gold Council - Gold Mid-Year Outlook 2025
- Federal Reserve - December 2025 FOMC Statement
- CNBC - Fed Interest Rate Decision December 2025
- Yahoo Finance - Gold Futures
- Good Returns - India Gold Rates
- LongtermTrends - Gold vs Real Yields
Ready to start investing in gold?
Join thousands of Indian families building wealth with Mantra Mint.
Get Started Free