Gold ETF Inflows Hit Record $57 Billion in 2025: What It Signals for 2026
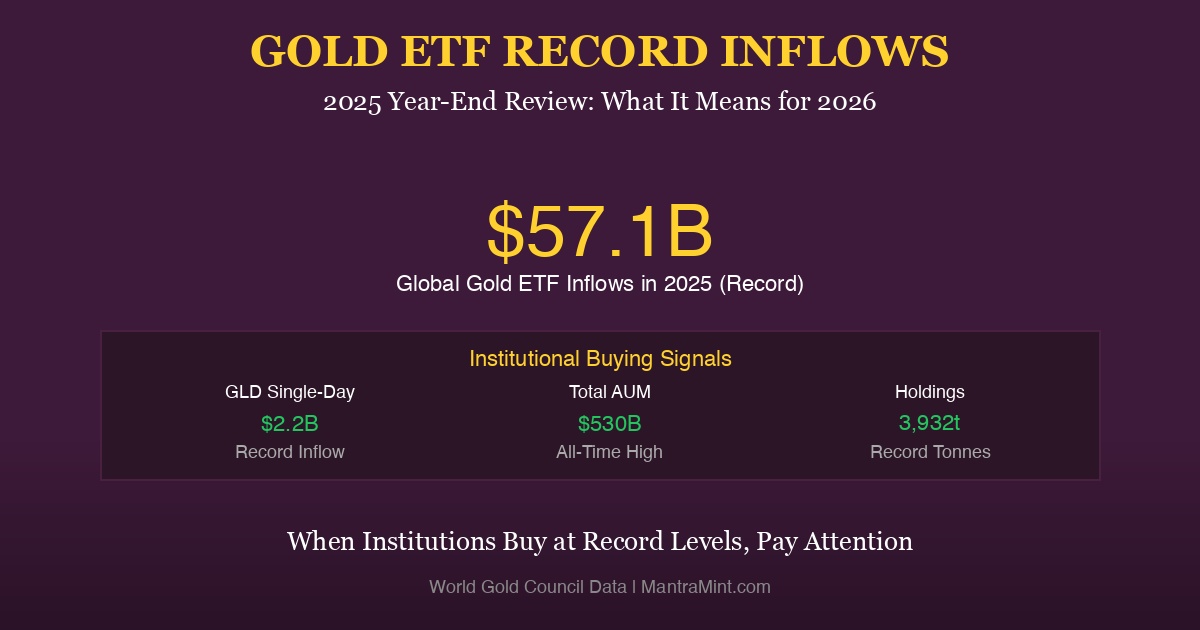
The numbers are in, and they’re historic. According to the World Gold Council, global gold ETFs attracted a record $57.1 billion in inflows during 2025, pushing total assets under management to an unprecedented $530 billion.
The SPDR Gold Shares (GLD), the world’s largest gold ETF, experienced its biggest single-day inflow ever—$2.2 billion on a single Friday—according to Bloomberg data cited by ETF.com. In fact, the three largest daily inflows in GLD’s 21-year history all occurred in 2025.
With gold at $4,350/oz and up 63% year-to-date, what do these record institutional flows tell us about 2026?
The Record-Breaking Numbers
Global Gold ETF Inflows (2025)
According to the World Gold Council’s November 2025 report:
| Metric | 2025 Total | Previous Record | Change |
|---|---|---|---|
| Global Inflows | $57.1 billion | $48B (2020) | +19% |
| Global AUM | $530 billion | $294B (Jan 2025) | +80% |
| Global Holdings | 3,932 tonnes | 3,929t (Nov 2020) | New record |
| US ETF Inflows | $32.7 billion | $15.1B (2020) | +117% |
Source: World Gold Council - Gold ETF Flows
Top U.S. Gold ETF Inflows (2025 YTD)
According to SSGA and ETF.com:
| ETF | Ticker | 2025 Inflows | AUM |
|---|---|---|---|
| SPDR Gold Shares | GLD | $12.9 billion | $139 billion |
| iShares Gold Trust | IAU | $8.6 billion | $64 billion |
| SPDR Gold MiniShares | GLDM | $6.2 billion | $23 billion |
| iShares Gold Trust Micro | IAUM | $2.2 billion | $5.5 billion |
| Others | Various | $2.8 billion | - |
| US Total | - | $32.7 billion | - |
GLD’s Historic Single-Day Record
According to ETF.com:
“GLD pulled in $2.2 billion on a single Friday, its largest single-day inflow in the fund’s 21-year history. Remarkably, the three biggest daily inflows GLD has ever seen have all occurred in 2025.”
| Rank | Date | Single-Day Inflow | Context |
|---|---|---|---|
| 1 | Dec 2025 | $2.2 billion | Record |
| 2 | Nov 2025 | $1.9 billion | 2nd highest ever |
| 3 | Oct 2025 | $1.7 billion | 3rd highest ever |
What’s Driving the Institutional Rush
1. Dollar Weakness
According to ABC News:
“The U.S. dollar plunged about 11% against other currencies in the first half of 2025—the biggest decline in more than 50 years.”
Institutional investors are hedging against continued dollar weakness with gold.
2. De-Dollarization Trend
According to the World Gold Council:
“Gold surpassed the share of U.S. Treasuries in central bank reserves for the first time since 1996.”
Institutions are following central banks’ lead.
3. Ballooning Government Debt
According to ETF.com:
“Investors have been rushing into gold ETFs as a hedge against ballooning government debt, persistent inflation, geopolitical tensions spanning wars and trade disputes.”
4. Federal Reserve Policy
The Federal Reserve cut rates by 175 basis points in 2025, bringing rates to 3.50-3.75%. Lower rates reduce the opportunity cost of holding non-yielding gold.
The Monthly Progression: How 2025 Unfolded
According to World Gold Council data:
| Month | AUM | Holdings | Key Event |
|---|---|---|---|
| January | $294B | 3,800t | Starting point |
| March | $320B | 3,820t | Fed signals cuts |
| June | $380B | 3,850t | Dollar weakens |
| August | $407B | 3,870t | Record highs begin |
| September | $472B | 3,838t | Q3 surge |
| October | $503B | 3,893t | Breaks $500B |
| November | $530B | 3,932t | New all-time high |
Source: World Gold Council - Monthly Reports
Regional Breakdown: Who’s Buying
North America: The Leader
According to the World Gold Council:
“North America’s inflow streak extended to six months, adding US$1 billion in November.”
| Region | 2025 Inflows | Share of Global |
|---|---|---|
| North America | $32.7 billion | 57% |
| Europe | $18.2 billion | 32% |
| Asia | $4.3 billion | 8% |
| Other | $1.9 billion | 3% |
| Total | $57.1 billion | 100% |
Why U.S. Investors Are Leading
| Factor | Impact on US Investors |
|---|---|
| Dollar weakness | Direct hedge needed |
| Debt concerns | $36T+ national debt |
| Fed uncertainty | Rate path unclear |
| Political risk | Policy uncertainty |
| Accessibility | 100+ gold ETFs available |
What Institutional Flows Signal
Institutions vs Retail Behavior
| Characteristic | Institutional | Retail |
|---|---|---|
| Time horizon | 3-5+ years | Often shorter |
| Position size | Billions | Thousands |
| Entry strategy | Systematic | Often emotional |
| Research depth | Deep due diligence | Variable |
| Signal value | Very high | Moderate |
When institutions buy at record levels, it signals:
- Conviction - They’ve done the research
- Continuation - They expect the trend to persist
- Validation - Gold’s role is being re-established
Historical Precedent
According to the World Gold Council:
| Year | ETF Inflows | Gold Performance (Following Year) |
|---|---|---|
| 2016 | $24B | +13% (2017) |
| 2019 | $16B | +25% (2020) |
| 2020 | $48B | -4% (2021) |
| 2025 | $57B | ? (2026) |
The correlation isn’t perfect, but strong inflows often precede continued upside.
Implications for 2026
What Analysts Expect
Based on institutional flows, analysts remain bullish:
| Institution | 2026 Target | Rationale |
|---|---|---|
| J.P. Morgan | $5,000/oz | Structural demand |
| Goldman Sachs | $4,900/oz | Central bank + ETF buying |
| Morgan Stanley | $4,800/oz | Continued momentum |
| UBS | $4,700/oz | Dollar weakness |
Source: J.P. Morgan Research
Key Levels to Watch
According to FXEmpire technical analysis:
| Level | Type | Significance |
|---|---|---|
| $4,200 | Support | 0.618 Fibonacci |
| $4,360 | Support | Key defense line |
| $4,550-4,600 | Resistance | Near-term pivot |
| $5,000 | Target | Psychological level |
Risks to the Thesis
| Risk | Probability | Impact |
|---|---|---|
| Dollar recovery | Moderate | Negative |
| Fed hawkish shift | Low | Negative |
| Profit-taking | High | Short-term |
| Geopolitical calm | Low | Neutral |
For Indian Investors: NRI Considerations
Gold ETFs vs Physical Gold
| Factor | Gold ETFs (GLD, IAU) | Physical Gold | Digital Gold |
|---|---|---|---|
| Tax rate | 28% (collectibles) | 28% (collectibles) | 28% |
| Storage | None | Safe/vault needed | None |
| Liquidity | Instant | Days | Instant |
| Minimum | 1 share (~$400) | Variable | $10+ |
| Gifting | Complex | Simple | Simple |
Why Retail Should Pay Attention
| Signal | Meaning |
|---|---|
| Record ETF inflows | Institutions see value |
| 6-month inflow streak | Not a one-time spike |
| $530B in AUM | Real money is committed |
| All-time high holdings | Conviction buying |
How to Position for 2026
Based on Institutional Behavior
| Your Situation | Strategy |
|---|---|
| No gold exposure | Build 10-15% allocation |
| Under-allocated | Add on pullbacks |
| Appropriately allocated | Hold, rebalance if >25% |
| Over-allocated | Take some profits |
Entry Strategy
| Approach | Method |
|---|---|
| Lump sum | Invest available capital now |
| DCA | Monthly systematic purchases |
| Hybrid | 50% now, 50% over 6 months |
| Tactical | Buy support levels ($4,200-4,300) |
The Bottom Line
Record gold ETF inflows of $57.1 billion in 2025 aren’t just a number—they’re a signal. When institutional investors pour billions into an asset class at this pace, they’re making a statement about the future.
According to SSGA:
“GLD is on pace to challenge its 2020 record of $15.1 billion in annual inflows.”
It didn’t just challenge—it nearly doubled it with $12.9 billion.
The institutional thesis is clear: gold’s structural role in portfolios is expanding. De-dollarization, debt concerns, and geopolitical uncertainty aren’t going away in 2026.
Build Your Gold Position with Mantra Mint
Institutions are buying gold at record levels. You don’t need billions to follow their lead.
Why Mantra Mint:
- Start with $10 — No minimum investment
- Real gold backing — Like the ETFs, but more flexible
- No storage hassles — Digital convenience
- Perfect for NRIs — Bridge USA and India
The Institutional Signal:
- $57B in global inflows
- 6-month buying streak
- All-time high holdings
- $530B in total AUM
When the smart money is buying, pay attention.
Start Your Gold Position — Follow the institutional trend.
Sources
- World Gold Council - Gold ETF Holdings and Flows
- World Gold Council - November 2025 Gold ETF Flows
- ETF.com - GLD Sees Record Inflows
- SSGA - Could Gold ETF Inflows Spur Record Prices
- Federal Reserve - December 2025 FOMC Statement
- J.P. Morgan - Gold Price Predictions
- FXEmpire - Gold Technical Analysis
- World Gold Council - Q3 2025 Gold Demand Trends
- ABC News - Gold Record Highs
- Nasdaq - Top 10 Gold ETFs 2025
Ready to start investing in gold?
Join thousands of Indian families building wealth with Mantra Mint.
Get Started Free