Fed Rate Cuts and Gold's 72% Rally: Why Lower Rates Mean Higher Gold Prices in 2026
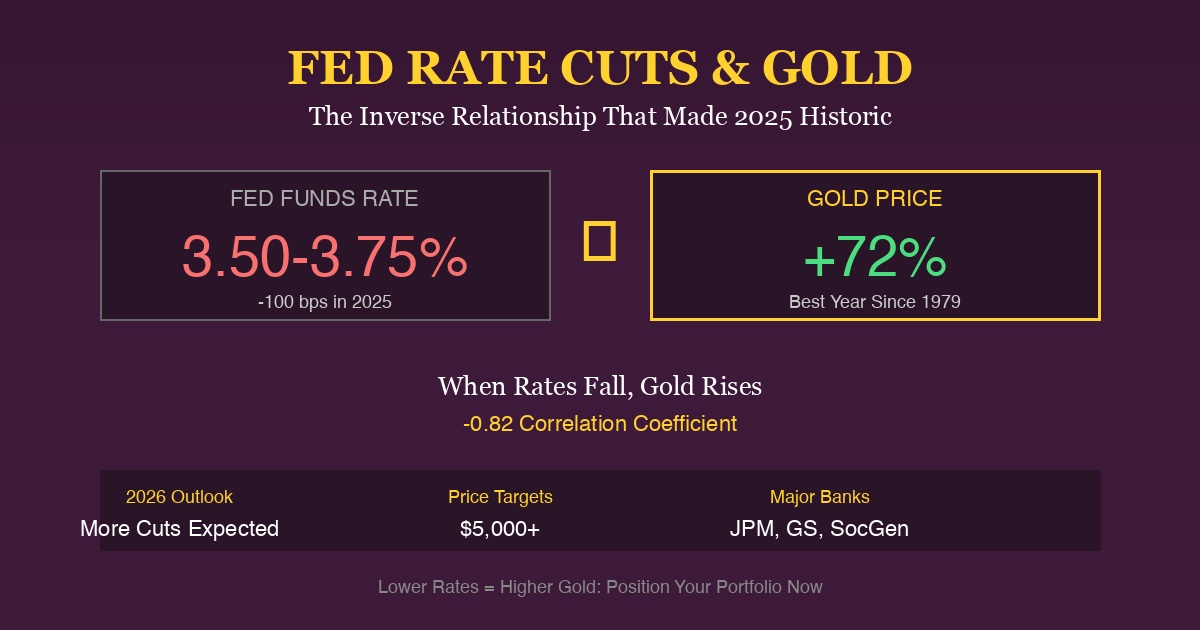
The Federal Reserve just completed its third consecutive rate cut, bringing the federal funds rate to 3.5%-3.75%. Gold responded by surging to $4,553/oz—a staggering 72% gain year-to-date, marking its best year since 1979. This isn’t coincidence. The relationship between Fed policy and gold prices is one of the most reliable correlations in financial markets.
According to USAGOLD, historical data reveals a correlation coefficient of approximately -0.82 between gold prices and real interest rates. When rates fall, gold typically rises—and the 2025 rally has proven this relationship in spectacular fashion.
Current Market Snapshot
| Metric | Current | Change | Source |
|---|---|---|---|
| Gold Spot Price | $4,553/oz | +72% YTD | Yahoo Finance |
| Silver Spot Price | $77.20/oz | +162% YTD | Yahoo Finance |
| Fed Funds Rate | 3.50-3.75% | -100 bps in 2025 | Federal Reserve |
| Gold/Silver Ratio | 59.0 | Down from 90 | Market data |
Gold Prices in India Today
| Metric | Price (₹) | Change | Source |
|---|---|---|---|
| 24K Gold (10g) | ₹1,40,020 | +75% YTD | GoodReturns |
| 22K Gold (10g) | ₹1,28,350 | +73% YTD | Market data |
| 18K Gold (10g) | ₹1,05,020 | +72% YTD | Market data |
| USD/INR | 89.75 | -6% YTD | Live rate |
The December FOMC Decision: What Happened
According to the Federal Reserve’s official statement and CNBC reporting:
December 10, 2025 FOMC Meeting
| Metric | Detail | Source |
|---|---|---|
| Rate Decision | -25 basis points | Federal Reserve |
| New Range | 3.50-3.75% | FOMC Statement |
| Vote | 9-3 split | CNN |
| 2025 Total Cuts | -100 basis points | Three consecutive cuts |
“We are well positioned to wait and see how the economy evolves. This was a close call.” — Fed Chair Jerome Powell, December Press Conference
The 2025 Rate Cut Timeline
| Date | Action | Rate After | Gold Price |
|---|---|---|---|
| September 17, 2025 | -25 bps | 4.25-4.50% | $3,800/oz |
| October 29, 2025 | -25 bps | 4.00-4.25% | $4,100/oz |
| December 10, 2025 | -25 bps | 3.50-3.75% | $4,450/oz |
| Current | — | 3.50-3.75% | $4,553/oz |
Why Fed Rate Cuts Drive Gold Higher
According to StoneX Bullion and Gainesville Coins:
The Inverse Relationship Explained
| Factor | How It Works | Impact on Gold |
|---|---|---|
| Opportunity cost | Lower rates = bonds pay less | Gold more attractive |
| Real yields | Nominal rate - inflation | When negative, gold shines |
| Dollar weakness | Rate cuts weaken USD | Gold priced in USD rises |
| Risk sentiment | Cuts signal concern | Safe-haven buying |
Historical Correlation Data
| Metric | Value | Implication |
|---|---|---|
| Gold-Real Rate Correlation | -0.82 | Strong inverse |
| Gold during 2008-2011 cuts | +166% | Fed cut to 0% |
| Gold during 2019-2020 cuts | +40% | Fed cut 150 bps |
| Gold during 2025 cuts | +72% | Fed cut 100 bps |
“Lower interest rates reduce the opportunity cost of holding non-yielding assets, making gold relatively more attractive. Rate cuts typically weaken the currency of the cutting central bank, creating a double tailwind for gold prices.” — Bullion Trading LLC
Gold’s Best Year Since 1979
According to CNN Business and Investing.com:
2025 Performance in Context
| Year | Gold Return | Catalyst |
|---|---|---|
| 1979 | +126% | Second oil crisis, inflation |
| 1980 | +71% | Hunt brothers, inflation peak |
| 2007 | +31% | Financial crisis begins |
| 2010 | +30% | Post-GFC stimulus |
| 2025 | +72% | Rate cuts, central banks, debt |
What Drove the 2025 Rally
| Driver | Contribution | Source |
|---|---|---|
| Fed rate cuts | Major | 100 bps total cuts |
| Central bank buying | Major | Record purchases |
| Geopolitical risk | Significant | Trade war, tariffs |
| Dollar weakness | Moderate | DXY fell to ~98 |
| Debt concerns | Significant | $38+ trillion debt |
“Gold is more than 70% higher year-to-date, its strongest annual gain since the late 1970s, firmly establishing gold as the main macro hedge in a year dominated by debt expansion, rate-cut expectations, and currency debasement narratives.” — TradingKey
What the Fed’s “Dot Plot” Says About 2026
According to the Federal Reserve projections and Fidelity analysis:
Official Fed Projections
| Metric | 2025 (Actual) | 2026 (Median) | 2027 (Median) |
|---|---|---|---|
| Fed Funds Rate | 3.50-3.75% | 3.25-3.50% | 3.00-3.25% |
| Rate Cuts | 3 (100 bps) | 1 (25 bps) | 1 (25 bps) |
| GDP Growth | 2.1% | 1.8% | 1.9% |
| Unemployment | 4.6% | 4.4% | 4.2% |
The Division Among FOMC Members
| Position | Number of Officials | Rate Expectation 2026 |
|---|---|---|
| No cuts in 2026 | 7 | Hold at 3.50-3.75% |
| One cut | 5 | 3.25-3.50% |
| Multiple cuts | 4+ | 3.00% or lower |
“The newest Fed projections show policymakers sharply divided on where rates could go next year, with expectations ranging from a small hike to cuts totaling as much as 1.50 percentage points.” — Yahoo Finance
Gold Price Forecasts for 2026
According to the World Gold Council and Morgan Stanley:
Major Bank Price Targets
| Institution | 2026 Target | % From Current | Source |
|---|---|---|---|
| JPMorgan Chase | $5,000+/oz | +10% | TradingKey |
| Goldman Sachs | $5,000/oz | +10% | Analyst report |
| Societe Generale | $5,000/oz | +10% | Research note |
| Morgan Stanley | $4,400/oz | -3% (conservative) | MS Research |
| UBS | $4,800/oz | +5% | Analyst forecast |
World Gold Council Scenarios
According to World Gold Council 2026 Outlook:
| Scenario | Economic Condition | Gold Projection |
|---|---|---|
| Base case | Soft landing | +5-10% from current |
| Bullish | Recession, more cuts | +15-20% (~$5,200+) |
| Bearish | No recession, Fed hikes | -5-10% (~$4,100) |
“In this environment, gold could rise 5%–15% in 2026 from current levels, depending on the severity of the economic slowdown and the speed and magnitude of rate cuts.” — World Gold Council
The Fed-Gold Correlation: Historical Evidence
According to State Street Global Advisors:
Gold Performance During Fed Cutting Cycles
| Cutting Cycle | Fed Funds Start | Fed Funds End | Gold Return |
|---|---|---|---|
| 2001-2003 | 6.50% | 1.00% | +31% |
| 2007-2008 | 5.25% | 0.00% | +25% |
| 2019-2020 | 2.50% | 0.00% | +40% |
| 2024-2025 | 5.50% | 3.50% | +72% |
Why This Cycle Has Been Different
| Factor | Previous Cycles | 2025 Cycle |
|---|---|---|
| Central bank buying | Moderate | Record high |
| Fiscal deficits | Elevated | Historic ($38T+) |
| De-dollarization | Minimal | Accelerating |
| Inflation stickiness | Transitory | Persistent |
| Gold ETF flows | Variable | $72B inflows |
Central Banks Are Reinforcing the Rally
According to Crux Investor:
2025 Central Bank Purchases
| Metric | 2025 | Context |
|---|---|---|
| Total CB buying | 1,000+ tonnes | Third consecutive year |
| Top buyer | China | Diversifying from USD |
| Gold ETF inflows | $72 billion | Record annual |
| ETF tonnage | 674 tonnes | Highest since 2020 |
“Gold ETFs posted five consecutive months of global inflows, driving 2025 totals to a record $72 billion or 674 tonnes, which surpasses 2020’s full-year haul.” — World Gold Council
What This Means for Investors
Two Scenarios for 2026
According to USAGOLD:
| Scenario | Fed Action | Gold Outlook |
|---|---|---|
| A: Fed is right | One cut to 3.25% | Gold consolidates $4,000-4,300 |
| B: Market is right | 3-4 cuts to 2.50% | Gold rallies to $5,000+ |
Key Indicators to Watch
| Indicator | Bullish for Gold | Bearish for Gold |
|---|---|---|
| Unemployment | Rising above 5% | Falling below 4% |
| Inflation (CPI) | Sticky above 3% | Falling below 2% |
| Fed dot plot | More cuts projected | Hikes projected |
| Dollar (DXY) | Below 95 | Above 105 |
| Real yields | Negative | Positive above 2% |
Investment Strategies for the Rate Cut Era
Dollar-Cost Averaging Into Gold
| Frequency | Amount | Annual Investment |
|---|---|---|
| Weekly | $50 | $2,600 |
| Biweekly | $100 | $2,600 |
| Monthly | $200 | $2,400 |
| Monthly | $500 | $6,000 |
Portfolio Allocation by Fed Outlook
| Investor View | Stock % | Bond % | Gold % | Rationale |
|---|---|---|---|---|
| Fed keeps cutting | 55% | 20% | 25% | Gold benefits from cuts |
| Fed pauses | 60% | 25% | 15% | Balanced approach |
| Fed hikes | 60% | 30% | 10% | Reduce gold exposure |
When to Increase Gold Allocation
| Trigger | Action |
|---|---|
| Fed signals more cuts | Add 5% gold |
| Unemployment rises above 5% | Add 5% gold |
| Dollar falls below DXY 95 | Add 5% gold |
| Real yields go negative | Significant increase |
For Indian Investors: Double Benefit
Rate Cuts Help NRIs Two Ways
| Scenario | USD Impact | Gold USD | Gold INR |
|---|---|---|---|
| Fed cuts rates | Weakens | Rises | Double gain |
| Dollar weakness | — | — | Rupee strengthens |
| Risk-off | Mixed | Rises | Safe haven both currencies |
Current Pricing Advantage
| Metal | USD Price | INR Price (10g) | Combined 2025 Return |
|---|---|---|---|
| Gold 24K | $4,553/oz | ₹1,40,020 | +75% in INR |
| Silver | $77.20/oz | ₹2,40,000+/kg | +180%+ in INR |
The Bottom Line: Fed Policy Matters for Your Gold
The math is simple:
- Fed cut 100 bps in 2025 → Gold rallied 72%
- More cuts projected in 2026 → Major banks see $5,000+
- -0.82 correlation → Rate cuts historically push gold higher
- Central banks buying record amounts → Structural support
Whether you believe the Fed will cut once or four times in 2026, the direction is clear: rates are coming down. And when rates fall, gold has historically risen. The question isn’t whether to own gold—it’s how much.
With major institutions projecting $5,000 gold and the Fed signaling more cuts ahead, building your gold position now positions you for whatever policy path the Fed takes.
Start Building Your Gold Position with Mantra Mint
The Fed has cut rates three times. Gold has rallied 72%. Major banks are calling for $5,000 gold in 2026. The time to build your position is now.
Why Gold, Why Now?
- Fed cut to 3.5%-3.75% — More cuts likely
- +72% in 2025 — Best year since 1979
- $5,000 price targets — From JPMorgan, Goldman, SocGen
- -0.82 correlation — Rates down = gold up
Why Mantra Mint?
- Start with $10 — Build your position gradually
- Auto-invest — Dollar-cost average into the rally
- Instant liquidity — Sell anytime if needed
- No storage hassles — We handle everything
Don’t fight the Fed. Own what benefits when rates fall.
Start Buying Gold Now — Position yourself for the rate cut era.
Sources
- Federal Reserve - FOMC Statement December 2025
- CNBC - Fed Interest Rate Decision December 2025
- CNN Business - Fed December Rate Decision Takeaways
- CNN Business - Gold’s Best Year Since Carter
- USAGOLD - Federal Reserve Policy Impact on Gold
- StoneX Bullion - Fed Rate Cuts and Gold
- Gainesville Coins - Federal Reserve Policies and Gold 2025
- World Gold Council - Gold Outlook 2026
- Morgan Stanley - Gold Price Forecast 2026
- State Street - Gold 2026 Outlook
- TradingKey - Wall Street Gold Forecasts
- Bullion Trading LLC - Fed Rate Cuts Gold Rally
- Investing.com - Gold Structural Bull Run
- Yahoo Finance - Gold Futures
- GoodReturns - India Gold Rates
Ready to start investing in gold?
Join thousands of Indian families building wealth with Mantra Mint.
Get Started Free