5 Catalysts That Drove Gold's Historic 63% Rally in 2025
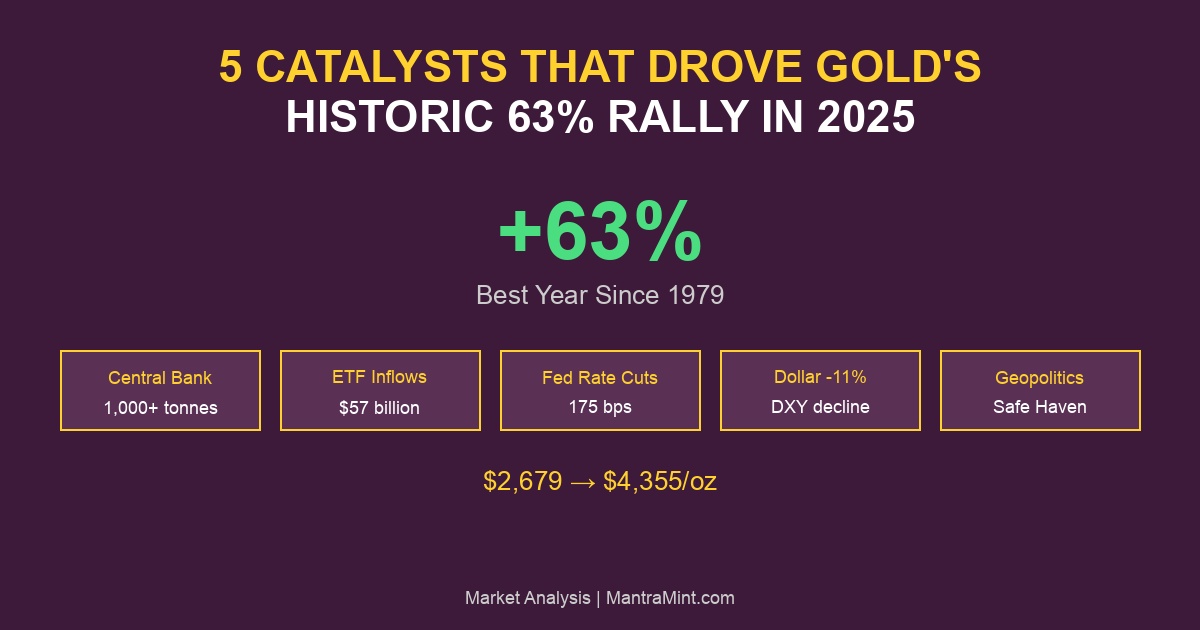
Gold delivered its best annual performance since 1979 in 2025, surging 63% from $2,679/oz at the start of the year to $4,355/oz today. According to J.P. Morgan Global Research, this rally was driven by a rare confluence of structural and cyclical forces that may not repeat for decades.
According to the World Gold Council’s 2026 Outlook, gold achieved over 50 all-time highs in 2025 alone. But what exactly drove this historic move? Here’s the definitive breakdown of the five catalysts that created a once-in-a-generation rally.
2025 Gold Performance Summary
| Metric | Value | Source |
|---|---|---|
| Starting Price (Jan 1) | $2,679/oz | Yahoo Finance |
| Current Price | $4,355/oz | Yahoo Finance |
| YTD Gain | +62.5% | Calculated |
| All-Time Highs | 50+ | TradingKey |
| Best Year Since | 1979 | CNBC |
| Peak Price (Dec 26) | $4,556/oz | Fortune |
Catalyst #1: Central Bank Buying Hit Record Levels
The most structural force behind 2025’s gold rally was unprecedented central bank accumulation. According to Amundi Research, gold surpassed US Treasuries as a share of central bank reserves for the first time since 1996.
Central Bank Buying Data
According to the World Gold Council:
| Period | Purchases | Context |
|---|---|---|
| 2022 | 1,082 tonnes | Post-Russia sanctions surge |
| 2023 | 1,037 tonnes | Second highest on record |
| 2024 | 1,045 tonnes | Third consecutive 1,000+ year |
| 2025 (projected) | 1,000+ tonnes | Fourth consecutive year |
| Q1-Q3 2025 | 634 tonnes | On pace for 1,000+ |
Why Central Banks Are Buying
According to Amundi:
“Central banks, particularly in emerging markets, have increased the pace of gold purchases roughly fivefold since 2022, when Russia’s foreign-currency reserves were frozen.”
| Central Bank Driver | Impact |
|---|---|
| De-dollarization | Reducing USD exposure |
| Sanction protection | Gold can’t be frozen |
| No counterparty risk | Self-custodied asset |
| Reserve diversification | Away from Treasuries |
Top Buyers in 2025
| Country | Purchases (tonnes) | Source |
|---|---|---|
| Poland | 90+ | World Gold Council |
| China | 80+ | World Gold Council |
| India | 60+ | World Gold Council |
| Turkey | 50+ | Industry estimates |
| Brazil | 31+ | World Gold Council |
Catalyst #2: Record ETF Inflows of $57 Billion
Institutional investors returned to gold in force in 2025. According to ETF.com, SPDR Gold Shares (GLD) logged its biggest daily inflow ever during the year.
ETF Inflow Data
According to the World Gold Council:
| Metric | 2025 Data | Source |
|---|---|---|
| Global ETF Inflows | $57.1 billion | ETF.com |
| US ETF Inflows | $32.7 billion | World Gold Council |
| Total AUM | $503 billion | World Gold Council |
| Holdings Added | 700+ tonnes | ING |
Major ETF Flows
According to Morningstar:
| ETF | 2025 Inflows | Source |
|---|---|---|
| SPDR Gold Shares (GLD) | $12.9 billion | ETF.com |
| iShares Gold Trust (IAU) | $8.6 billion | ETF.com |
| SPDR Gold MiniShares (GLDM) | $6.2 billion | ETF.com |
| iShares Gold Micro (IAUM) | $2.2 billion | ETF.com |
Record September 2025
According to Morningstar:
“Gold ETFs posted their largest monthly inflows ever in September, according to the World Gold Council, with close to $11 billion in the month.”
| September 2025 | Data |
|---|---|
| Monthly inflows | ~$11 billion |
| GLD alone | $4+ billion |
| Q3 total | $26 billion (record) |
Catalyst #3: Federal Reserve Cut Rates by 175 Basis Points
Lower interest rates reduce the opportunity cost of holding non-yielding gold. In 2025, the Federal Reserve delivered the rate cuts gold bulls had been waiting for.
Fed Rate Cuts in 2025
According to the Federal Reserve:
| Meeting | Action | New Rate |
|---|---|---|
| September 2025 | -50 bps | 4.50-4.75% |
| October 2025 | -50 bps | 4.00-4.25% |
| December 2025 | -25 bps | 3.50-3.75% |
| Total 2025 | -175 bps | - |
Gold-Rate Correlation
According to USAGOLD:
| Fed Action | Historical Gold Response |
|---|---|
| Rate cuts | Typically bullish |
| Rate hikes | Typically bearish |
| Uncertainty | Very bullish |
According to J.P. Morgan:
“The scorching rally has been supported by elevated central-bank purchases, inflows to exchange-traded funds and three successive interest-rate cuts by the US Federal Reserve.”
Why Rate Cuts Help Gold
| Factor | Impact |
|---|---|
| Lower opportunity cost | Gold doesn’t pay interest |
| Weaker dollar | Inverse correlation |
| Inflation hedge appeal | Real returns matter |
| Risk-on sentiment | Liquidity boost |
Catalyst #4: Dollar Weakness (-11% in H1)
The US dollar experienced its worst first-half performance in over 50 years, directly boosting gold prices. According to Morningstar, the DXY index fell about 11% from January to June 2025.
Dollar Decline Data
According to RBC Wealth Management:
| Metric | 2025 Data | Source |
|---|---|---|
| H1 2025 DXY decline | -10.7% | Morningstar |
| Worst H1 since | 1970s | RBC |
| Pre-decline rally | 10 years, +40% | Industry data |
Why the Dollar Weakened
According to Cambridge Currencies:
| Factor | Impact |
|---|---|
| Slowing US growth | Relative disadvantage |
| Fed rate cuts | Narrowing yield gap |
| Tariff uncertainty | Trade disruption |
| Fiscal deficits | Long-term concerns |
| De-dollarization | Global diversification |
Gold-Dollar Inverse Correlation
According to Investing.com:
“The U.S. Dollar Index (DXY) has declined over 10% this year, contributing to gold’s ascent. Historically, gold and the DXY exhibit an inverse correlation; when the dollar weakens, gold becomes more attractive to foreign investors.”
| Dollar Move | Typical Gold Response |
|---|---|
| DXY down 5% | Gold up 5-8% |
| DXY down 10% | Gold up 10-15%+ |
| DXY down 11% | Gold up 63% (2025) |
Catalyst #5: Geopolitical Tensions and the “Debasement Trade”
Multiple geopolitical flashpoints created safe-haven demand throughout 2025. According to LSEG, gold broke through $4,000 for the first time amid global uncertainty.
Major Geopolitical Events
According to Discovery Alert:
| Event | Gold Impact |
|---|---|
| Russia-Ukraine stalemate | Sustained safe-haven bid |
| Trump tariff announcements | Market volatility |
| US-China trade tensions | De-dollarization acceleration |
| Venezuela tensions | December spike |
| Middle East uncertainty | Risk premium |
The “Debasement Trade”
According to FXStreet:
“The US Dollar, the global trade settlement currency, is losing trust among investors and international holders of US sovereign debt… This shift, now generally referred to as ‘the great debasement trade,’ is catalyzing the bull cycle in the commodities market.”
US Fiscal Concerns
According to the World Gold Council:
| US Fiscal Metric | 2025 Data | Source |
|---|---|---|
| FY 2025 Deficit | ~$1.8 trillion | GAO |
| Debt-to-GDP | ~125% | Lyn Alden |
| Projected 2047 | 200% of GDP | GAO |
According to the World Gold Council:
“The differential between US Treasuries and swap rates, which is at least partly linked to US fiscal concerns, is statistically significant in explaining movements in the gold price.”
How the 5 Catalysts Interacted
The remarkable 63% rally wasn’t caused by any single factor—it was the confluence of all five catalysts reinforcing each other:
| Catalyst | Direct Impact | Indirect Effect |
|---|---|---|
| Central Banks | Floor under prices | Validates gold as reserve asset |
| ETF Inflows | Demand surge | Signals institutional confidence |
| Fed Rate Cuts | Lower opportunity cost | Weakens dollar |
| Dollar Weakness | Foreign buying | Reinforces de-dollarization |
| Geopolitics | Safe-haven demand | Accelerates central bank buying |
Monthly Gold Price Journey
| Month | Price | Key Driver |
|---|---|---|
| January | $2,679 | Base |
| March | $3,000 | Tariff fears |
| June | $3,400 | Fed pivot signals |
| September | $3,800 | Fed 50bp cut |
| October | $4,000 | Breakthrough |
| December 26 | $4,556 | Peak |
| December 30 | $4,355 | Current |
What Made 2025 Different from Previous Rallies
According to State Street Global Advisors:
| Historic Rally | Duration | Driver | Gain |
|---|---|---|---|
| 1979-1980 | 2 years | Inflation, Iran | +300% |
| 2008-2011 | 3 years | Financial crisis, QE | +150% |
| 2020 | 1 year | COVID, QE | +25% |
| 2025 | 1 year | All 5 catalysts | +63% |
2025’s rally was unique because it combined:
- Structural demand (central banks, not just traders)
- Institutional validation (record ETF flows)
- Policy support (aggressive Fed cuts)
- Currency dynamics (historic dollar weakness)
- Risk-off environment (multiple geopolitical crises)
Lessons for Investors
What 2025 Taught Us
| Lesson | Implication |
|---|---|
| Diversification matters | Gold +63% vs S&P +24% |
| Central banks signal trends | Follow the smart money |
| Dollar isn’t invincible | Currency diversification key |
| Geopolitics moves markets | Safe havens have value |
| Structural > Cyclical | Long-term trends dominate |
Going Into 2026
According to Morgan Stanley:
“Gold’s main drivers, including central bank buying, Fed rate cuts, a weaker dollar, concerns about the Fed’s independence, and ETF buying, are all still in place.”
| 2026 Catalyst | Status |
|---|---|
| Central bank buying | Continuing |
| ETF flows | Positive |
| Fed rate cuts | Expected |
| Dollar weakness | Likely |
| Geopolitical risk | Elevated |
For Indian Investors: What This Means
India-Specific Takeaways
| Factor | India Impact |
|---|---|
| RBI gold buying | 60+ tonnes in 2025 |
| Rupee depreciation | Amplified returns |
| Wedding season | Structural demand |
| Import duty cut | 15% → 6% |
Gold Returns in INR
| Metric | 2025 |
|---|---|
| USD gold gain | +63% |
| INR depreciation | ~5-8% |
| Total INR return | ~70%+ |
The Bottom Line
Gold’s 63% rally in 2025 was driven by a rare confluence of five powerful catalysts:
- Central Bank Buying: 1,000+ tonnes for the fourth consecutive year
- ETF Inflows: $57 billion in global flows
- Fed Rate Cuts: 175 basis points of easing
- Dollar Weakness: -11% in H1, worst in 50+ years
- Geopolitical Tensions: Multiple crises driving safe-haven demand
According to J.P. Morgan:
“Prices are expected to push toward $5,000/oz by the fourth quarter of 2026, with $6,000/oz a possibility longer term.”
This wasn’t just a cyclical rally—it was a structural shift in how the world values gold. Central banks aren’t speculating; they’re reallocating reserves. ETF investors aren’t trading; they’re building positions. The forces that drove gold in 2025 remain firmly in place for 2026 and beyond.
Position for 2026 with Mantra Mint
The five catalysts that drove gold’s 63% rally aren’t going away. Position yourself now.
Why Mantra Mint:
- Start with $10 — No minimum investment
- Real gold backing — Like central banks, not paper promises
- Instant purchase — Build your position today
- Perfect for NRIs — Bridge USA and India seamlessly
The 5 Catalysts:
- Central banks: 1,000+ tonnes/year (continuing)
- ETF inflows: $57 billion (accelerating)
- Fed rate cuts: More expected in 2026
- Dollar weakness: Structural, not cyclical
- Geopolitics: Tensions remain elevated
Don’t miss 2026’s rally.
Start Your Gold Position — Follow the catalysts.
Sources
- J.P. Morgan - Gold Price Predictions
- World Gold Council - Gold Outlook 2026
- Amundi Research - Gold Beyond Records
- ETF.com - GLD Record Inflows
- Morningstar - Gold ETFs Capture $9 Billion
- Federal Reserve - December 2025 FOMC
- Morningstar - Dollar Weakness 2026
- RBC Wealth Management - US Dollar Transition
- LSEG - Gold’s Meteoric Rise 2025
- FXStreet - The Debasement Trade
- World Gold Council - Fiscal Concerns and Gold
- Morgan Stanley - Gold Price Forecast 2026
- ING - Gold’s Bull Run 2026
- State Street Global Advisors - Gold 2026 Outlook
Ready to start investing in gold?
Join thousands of Indian families building wealth with Mantra Mint.
Get Started Free